HTMLCanvasElementCanvasRenderingContext2DbeginPath()closePath()stroke()fill()lineTo (x, y)moveTo (x, y)rect (x, y, w, h)quadraticCurveTo (cpx, cpy, x, y)bezierCurveTo (cp1x, cp1y, cp2x, cp2y, x, y)arc (x, y, r, start, end, anticlockwise)arcTo (x1, y1, x2, y2, radius)clip()isPointInPath (x, y)The canvas element, introduced in HTML5, enables the dynamic generation of bitmap images by means of JavaScript code.
The basic setup is a little complicated, the involved objects themselves are poorly designed, which is also a result of a real decrease in the evolution of the standards. But there is also a combination of reasons that makes the canvas element worth learning and exercising: it is the future element for graphics and even video in HTML, it is extremely powerful and, in combination with its natural habitat of a full scripting language, flexible and fully adaptable to all needs.
The interfaces of the JavaScript objects are messy, actions are not properly separated and the effect of the methods depends on odd side effects and property settings. But these interfaces are small: Part 2 of the contents table already provides an entire summary and overview. This reduction to less than 20 properties and 35 methods makes the full features of the canvas element manageable and comprehesible. With a background knowledge of HTML, CSS and at least a little JavaScript, this Canvas Handbook might be able to serve as both, an introduction and a daily work companion sufficient to master the entire subject.
This Handbook has three parts:
HTMLCanvasElement and 2. the CanvasRenderingContext2D. Think of this second part as a user-friendly version of the official [W3C] standard for the canvas element. The properties and methods are structured as given in the reference summary of that document.
If you are a novice, read the first part and then browse through the second part for the things you need.
There are nice online resources that taught me the first steps, especially the Canvas tutorial from the Mozilla Developer Network.
This handbook itself was written in Markdown and converted to HTML by means of the wonderful Pandoc universal document converter.3
These are the official papers that describe and define the canvas element:
The canvas element is part of HTML5. If a browser is too old or not capable of dealing with this fairly new standard, you will not be able to use it, at all.
A detailed overview of browser support for HTML5 in general and the canvas element in particular can be found for example at caniuse.com.
Furthermore, your browser must be able and permitted to execute JavaScript code. A couple of years ago, JavaScript had the reputation of annoying the user and in many configurations it was switched off by default. But all this is a thing of the past, certainly if you don't want to miss the full features of HTML5 and the canvas element in particular.
For the understanding of this very text, make sure, that your browser is up to date and properly configured (see the first example next as a test to assure that it works properly). All the illustrations and examples are not inserted as <img> images, but with canvas elements.
Here is an example of a canvas picture, showing a "Hello" message in a red box: 7
The source code for this picture is this: 8
<canvas id="VeryFirstExampleCanvas" width=150 height=60>
  GO AND UPDATE YOUR BROWSER BEFORE YOU READ ON!
</canvas>

<script>
  var canvas = document.getElementById ('VeryFirstExampleCanvas');    // access the canvas object
  var context = canvas.getContext ('2d');                             // access the canvas context
  context.fillStyle = 'red';                                          // set the color to 'red'
  context.fillRect (0,0,150,60);                                      // draw a red box on the whole of the canvas
  context.fillStyle = 'yellow';                                       // set the color to 'yellow'
  context.fillRect (5,5,140,50);                                      // draw a yellow box inside the red one
  context.fillStyle = 'red';                                          // set the color back to 'red'
  context.font = '40pt Arial';                                        // define the CSS font for writing text
  context.fillText ('Hello',10,50);                                   // write the text 'Hello'
</script>
This little example already comprises all the basic ingredients and steps we will repeat again and again later on. Every normal canvas picture has two parts of code:
First, there is the <canvas>...</canvas> part, which is part of the HTML file at the place where the picture is supposed to be located.
It has the two attributes for width and length, that define the size of the rectangular picture, measured in pixels. In this example, it is 150 pixel wide and 60 pixel high.
The text inside the <canvas>...</canvas> tag is not the "content" of the canvas, it is only a so-called "fallback" message. This is what the user is ought to see if the browser is too old or not capable of dealing with canvas elements.
The second part of code is the JavaScript script. In this example, it is put directly underneath and inside a <script>...</script> tag. But in fact, the location of this code part is fairly arbitrary and it is often moved into separate .js file. The script typically performs three steps:
Load the HTML <canvas> tag into a HTMLCanvasElement object. We saved it in a variable named canvas by calling the first line
var canvas = document.getElementById('VeryFirstExampleCanvas');The picture is not directly generated in the HTMLCanvasElement, but in its so-called context, an internal CanvasRenderingContext2D object that we saved in another variable named context by calling the second line
var context = canvas.getContext('2d');Now, everything is set to "draw stuff" on the canvas by modifying properties and calling methods, namely:
context.fillStyle = 'red';          // set the color to 'red'
context.fillRect (0,0,150,60);      // draw a red box on the whole of the canvas
context.fillStyle = 'yellow';       // set the color to 'yellow'
context.fillRect (5,5,140,50);      // draw a yellow box inside the red on
context.fillStyle = 'red';          // set the color back to 'red'
context.font = '40pt Arial';        // define the CSS font for writing text
context.fillText ('Hello',10,50);   // write the text 'Hello'
The context is the place where the picture content is generated and describing its properties and methods comprises the biggest part of this Handbook. But in order to work with the canvas element we need to understand these basic steps.
Let us exercise the same steps again. This time we generate the national flag of France.
The source code is this:
<canvas id="LittleTricolour" width=120 height=90> Your browser still doesn't work! </canvas>
<script>
  // First, get hold of the canvas object and its context
  var tricolourCanvas = document.getElementById('LittleTricolour');    // access the canvas object
  var tricolourCanvasContext = tricolourCanvas.getContext('2d');       // access the canvas context
  // Now do the real drawings:
  tricolourCanvasContext.fillStyle = '#0055A4';    // set the color to blue
  tricolourCanvasContext.fillRect ( 0, 0, 40, 90); // draw a blue rectangle on the left
  tricolourCanvasContext.fillStyle = '#FFFFFF';    // set the color to white
  tricolourCanvasContext.fillRect (40, 0, 40, 90); // draw a white rectangle in the middle
  tricolourCanvasContext.fillStyle = '#EF4135';    // set the color to red
  tricolourCanvasContext.fillRect (80, 0, 40, 90); // draw a red rectangle on the right
</script>
All visual picture elements are purely generated in the canvas context, stored in the JavaScript variable arbitrarily named tricolourCanvasContext.
Every canvas element exists in two worlds and two forms:
the <canvas> tag, i.e. the <canvas>...</canvas> structure which is part of the HTML code
the HTMLCanvasElement object, which is a proper JavaScript object and contains another so-called context object, where the actual picture elements are generated.
This double nature of HTML tag on one hand and JavaScript object on the other is not specific to the canvas element, it is essential to the whole design of the DOM (Document Object Model)9 that enables the dynamic manipulation of a document by means of JavaScript.
<canvas> tag
In some ways, the <canvas> tag is similar to the <img> tag for displaying images. For example, the source code
<img src="horse.jpg" width=100 height=100 alt="SOMETHING GOES WRONG" style="border: solid 5pt orange"> </img>generates the following image in your browser
With width and height we set the size of the picture. (Recall, that in each case 100 is short for "100px".) With alt we provide some "alternative" or fallback text that would appear in case the image cannot be displayed for any reason. The general style attribute for HTML elements is used to set some CSS attributes. In this case it draws an orange border around the picture. And of course, we could have omitted the closing </img> tag.
The <canvas> tag has similar features. For example, this line of code
<canvas width=100 height=100 style="border: solid 5pt orange"> SOMETHING GOES WRONG </canvas>appears like that
Again, width and height are set, these are actually the only two own attributes of the <canvas> tag. The style attribute is a general attribute for HTML elements and again it puts an orange frame around the canvas. If we would have omitted this attribute, we wouldn't be able to properly see the canvas, at all.
Different to the alt attribute for the <img> tag, the fallback content for the <canvas> is not located in an attribute, but goes inside the <canvas>...</canvas> tags.
By the way, width and height may actually be omitted, in which case the width is set to 300px and the height to 150px, by default. For example,
<canvas style="border: solid 5pt orange"> </canvas>appears like that
The style attribute is a general option for all HTML tags to add some CSS features. But in fact, that is not the place where the actual picture content of a canvas element is drawn. That is done in the so-called canvas context.
The real graphical content and the picture elements of a canvas is neither located in attributes nor inbetween the <canvas>...</canvas> tag. It is not written in HTML or CSS at all. Instead, it is done in the so-called canvas context, and this context can only be accessed and modified in JavaScript.
There are different ways to get a canvas picture on the screen. In fact, it can even be entirely done in JavaScript, without a <canvas> tag involved at all. But we do not intend to delve into the JavaScript DOM too deeply and propagate a standard method, instead, that should suffice in most cases.
The standard method is this: 10
In our HTML file we place a <canvas>...</canvas> tag at the place where the canvas picture is supposed to appear.
We attach an id attribute with an arbitrary name (in our case myCan). Be careful not to use the same name for more than one tags, i.e. give a different ID to every other canvas.
We then gain access to the canvas object representing the canvas element in the DOM by calling
document.getElementById('myCan');This object is a JavaScript object of type HTMLCanvasElement. By default we attach a name, usually canvas (but myCan, canvasNo27 etc. is equally possible), to this object by calling
var canvas = document.getElementById('myCan');That way, we get easy access to it later in the script.
Now we need to get to the 2d context of this canvas object by calling getContext('2d'). And again we immediately attach a name to it, usually context (other authors prefer ctx or whatever). So this is our next line of code
var context = canvas.getContext('2d');Note, that we would have obtained the same result with this line instead:
var context = document.getElementById('myCan').getContext('2d');but of course, it is much more convenient to use the canvas variable as a handle to the canvas object.
Now we have everything prepared to do the real drawings by changing and adding stuff to the 2d context named context. That means either getting or setting context properties, like we did in
context.fillStyle = 'red';or calling context methods, as done by
context.fillRect(0,0,150,60);So alltogether, this is our default template for generating canvas pictures, at least for now:
<canvas id="MyCanvasNo123" width=150 height=75> </canvas>
<script>
  var canvas = document.getElementById ('MyCanvasNo123');
  var context = canvas.getContext ('2d');
  // ...
  // ... do stuff with the context ...
  // ...
</script>
We use this template throughout this text and in many examples, we only show the "... do stuff with the context ..." part, assuming that you know about the other lines. For most examples, this simple template will work and it is a sufficient starting place for the design of your own sample files and paintings.
But on a more professional level and when the generated pictures become more complex, you should change this design:
In bigger projects, it is a common rule to separate content and style and the script should move to a designated section or even an external js file.
When the whole project is online and the browser needs to download more than one file, delays can cause canvas elements not to be rendered at all. Certainly, when images or other media files are involved, it is important to make sure that the script parts are executed only after the whole HTML code is loaded.
All these issues are dealt with in the Templates section of the appendix.
By the way, there are context types other than the 2d context with its CanvasRenderingContext2D objects. The [W3C] contains a note, saying: A future version of this specification will probably define a 3d context (probably based on the OpenGL ES API). But all this is outside the scope of this text and not widely supported by the major browers, yet.
(x,y) and the canvas coordinatesEach canvas has a width and a height, and by default these are 300 and 150 pixels, respectively. This means, that the canvas is divided into 300 pixels into the horizontal or x-axis, and 150 pixels into the vertical or y-axis. The x-axis runs from left 0 to right 300, the y-axis from top 0 to bottom 150. 11
Inside this coordinate system, any point on the canvas is precisely defined by the number pair (x,y), with 0 ≤ x ≤ width and 0 ≤ y ≤ height.
For example, the point at (200,25) on a default size 300x150 pixel canvas is represented by the red dot 12
But as this location is difficult to verify for the reader, we often display a coordinate system or grid on canvas examples below. The same point is then easy to locate:
All points (x,y) that fall outside the range of 0 ≤ x ≤ width and 0 ≤ y ≤ height are not shown. For example, the points (-60,50) or (500,500) do not appear in the previous canvas.13 If (parts of) figures exceed the borders of the canvas, the exceeding parts are simply cut off, as for the following disk with center point (250,100) and radius 100.
If we draw say the German flag on such a grid
then the code is easier to follow on the picture result, namely: 14
context.fillStyle = '#000000';  // set the color to black ('#000000' is the same as 'black')
context.fillRect(0, 0,200,40);  // draw a rectangle field with top left point at (0,0), 200 pixel wide and 40 pixel high
context.fillStyle = '#FF0000';  // set the color to red (which is '#FF0000' is CSS hexadecimal color notation)
context.fillRect(0,40,200,40);  // draw same size (200x40 pixel) rectangle at (0,40)
context.fillStyle = '#FFCC00';  // set the color to gold
context.fillRect(0,80,200,40);  // last rectangle with left top point at (0,80)
Actually, we can add such a grid to the context by calling the context.addGrid() method, which may become very convenient when you write code. Once the whole canvas is drawn, you can simply eliminate that line, again. However, note that addGrid() is not a standard method of the CanvasRenderingContext2D object! If you want to use it yourself, you need to copy the implementation from the appendix into your own file.
HTMLCanvasElementThe canvas element is given in two forms: as HTML tag and JavaScript object. In this reference, we concentrate on the JavaScript side of things. But completeness sake, let us provide a short repetition of the basic setup
<canvas> tag
In HTML5 a <canvas> tag has the general form
<canvas id="...." width="..." height="...">
  ... fallback content ...
</canvas>
In fact, the canvas element has only two own attributes, width and height. Both are optional, and if they are omitted, the width is set to 300px and the height to 150px, by default.
The ... fallback content ... is what appears in the browser not capable of HTML5. Since we do not need to consider this situation here, we will just use this as the standard form for our examples:
<canvas id="..." width="..." height="..."> </canvas>The id attribute is just a general attribute for HTML element. But we add it in our examples below, because it provides a standard way to get hold of the HTMLCanvasElement object in JavaScript. Usually, we will do something like this
<canvas id="mycanvas" width=100 height=100> </canvas>
<script>
  var canvas = document.getElementById ("mycanvas");
  // ... now, we have the canvas element available and can manipulate it ...
</script>
The canvas variable is then a handle to the HTMLCanvasElement.
HTMLCanvasElement
The JavaScript canvas object is a HTMLCanvasElement. It has:
two properties, namely
two methods, namely
getContext() that provides access to the canvas context,
toDataURL() that translates the full content of the given canvas into code for an image file (PNG or JPEG).
The canvas object is pretty simple, the actual drawings and picture elements are generated in its context. In general and in this handbook, we consider only one kind of context, namely the 2D context, which is comprehensively documented under the header CanvasRenderingContext2D in the second part of this reference.
width
HTMLCanvasElement.widthstores the width of the canvas element, as given by the
widthattribute of the<canvas>tag. It is also possible, however, to change that value. By default, a canvas has a width of300pixel.
For example, let us place a <canvas> tag of non-default width and height and attach an orange border (via its style attribute), so that this is visible. Then we add a script that takes this canvas, reads out its width and height and writes the result into the canvas. Alltogether,
<canvas id="SizeReadingSample" width=456 height=123 style="border: 5pt solid orange"> </canvas>
<script>
  var canvas = document.getElementById('SizeReadingSample');
  var message = "This canvas is " + canvas.height + " pixel high and " + canvas.width + " pixel wide.";
  var context = canvas.getContext('2d');
  context.font = "20px Arial";
  context.fillText (message, 15, 70);
</script>
is the code that produces this picture
height
HTMLCanvasElement.heightstores the height of the canvas element, as given by the
heightattribute of the<canvas>tag, which is150by default.
In the previous example we saw that height and width are readable properties. But they are also writable and we can dynamically change these values.
For example, suppose we have a <canvas> of default size, i.e. 300 pixel wide and 150 high, and we again add an orange border to it via its style attribute to visualize its shape.
<canvas id="SizeChangingSample" width=300 height=150 style="border: 5pt solid orange"> </canvas>Then we add a script in which we explicitly resize the canvas by setting both width and height to only 30 pixel, like so:
var canvas = document.getElementById('SizeChangingSample');
canvas.width = 30;
canvas.height = 30;
The result is indeed a smaller, resized canvas, namely this:
getContext('2d')
HTMLCanvasElement.getContext (contextId)returns the so-called context, i.e. an object that exposes an API for drawing on the canvas. Currently, only the
CanvasRenderingContext2Dobject is supported, and for that thecontextIdis'2d'. The result of this call will benullif the given context ID is not supported.
This context, which will always be the 2D context in the sequel, is attached to the canvas and accessible by a call of canvas.getContext('2d'). This context is where all the action takes place. It provides the interface for all the drawings added to the given canvas and explaining the CanvasRenderingContext2D object below is thus the biggest part of this manual.
The [W3C] document announces that there will probably be a '3d' context in the future, based on the OpenGL ES API.
toDataURL()
HTMLCanvasElement.toDataURL ()HTMLCanvasElement.toDataURL (type,... )Returns a
data:URL for the image in the canvas. The first optionaltypeargument controls the type of the image to be returned (e.g. PNG or JPEG). The default type is'image/png'for PNG images. The other arguments are specific to the type and control the way that the image is generated.
Let us consider a very tiny canvas example, say a red 20x20 pixel rectangle
generated by the following code
<canvas id="DataUrlSample" width=20 height=20></canvas>
<script>
  var canvas = document.getElementById ('DataUrlSample');
  var context = canvas.getContext ('2d');
  context.fillStyle = 'red';
  context.fillRect (0, 0, 20, 20);
</script>
We can now convert the canvas into a PNG data URL by calling:
var dataUrl = canvas.toDataURL(); and dataUrl now holds this string:
If you copy this string and put it into the address field of your browser, you should see the picture of the red square.
We can also convert to a JPEG like so
var dataUrl = canvas.toDataURL('image/jpeg'); and then the result is this string:
You can copy all this and call it in your browser to get the little red square, again.
For a more convenient solution, we can attach these lines to the previous code: 15
canvas.onclick = function () {
  window.location = canvas.toDataURL('image/png');
};
If we then click on the canvas, the browser opens the data URL into the address field and thus shows the image. And then, the user can choose to save this image as a PNG file.
CanvasRenderingContext2Dcanvas
CanvasRenderingContext2D.canvasrefers back to the
HTMLCanvasElementof that given context.
Suppose we have the following piece of code:
<canvas id="ReferenceSample1" width=150 height=100 style="border: solid 5pt orange"> </canvas>
<script>
  var context = document.getElementById('ReferenceSample1').getContext('2d');
  context.canvas.width = 250;        // reset the canvas width to 250
  context.canvas.height = 50;        // reset the canvas height to 50
</script>
which appears as a 250x50 pixel canvas (visible due to its solid 5pt orange border):
The original size of the canvas as given in the <canvas> tag is 150x100 pixel. The JavaScript variable context holds the CanvasRenderingContext2D object. With context.canvas we get hold of the HTMLCanvasElement that contains this context. So with context.canvas.width and context.canvas.height we refer to the width and height of this canvas.
Of course, we would have obtained exactly the same picture with:
<canvas id="ReferenceSample2" width=150 height=100 style="border: solid 5pt orange"> </canvas>
<script>
  var canvas = document.getElementById('ReferenceSample2');
  var context = canvas.getContext('2d');
  canvas.width = 250;
  canvas.height = 50;
</script>
But the point here was the demonstration of the ability to refer to the canvas object from its 2D context.
A drawing state is the set of the current settings of a
CanvasRenderingContext2Dobject. It includes the current style values (strokeStyleandfillStyle),globalAlphaandglobalCompositeOperation, the line (lineWidth,lineCap,lineJoin,miterLimit), shadow (shadowOffsetX,shadowOffsetY,shadowBlur,shadowColor) and text settings (font,textAlign,textBaseline), the current clipping region and the current transformation matrix.Each
CanvasRenderingContext2Dobject maintains a stack of drawing states. And withsave()andrestore(), drawing states can be pushed onto this stack and recovered at a later point.
Note, that the drawing state does not include the current path or bitmaps. So save() and restore() do not save and restore entire canvas pictures, i.e. entire contents of the given context. For that, you should use ImageData objects and the getImageData() and putImageData() methods (see the chapter on pixel manipulation).
Suppose we draw 5 figures, each one a fillRect() rectangle with two lines of strokeText() text in it, like so:
As it is apparent from the picture, we use 3 different style settings for the 5 figures, defined as states:
fillStyle, running from top red to bottom green and yellow strokeStyle.fillStyle, running from a orange center start to an outer green end circle and green strokeStyle.fillStyle and light gray strokeStyle.We could generate the previous canvas by following these steps:
But since we want to demonstrate the use of save() and restore(), we create the Figures in their presented order:
The full source code that actually generated the canvas is this:
// Text style settings (these will be part of Start A, B, and C alike, because they do not change)
context.textAlign = 'center';
context.textBaseline = 'middle';
context.lineWidth = 2.0;
context.font = '25px Arial';
// Settings for State A
var verticalGrad = context.createLinearGradient (0,0,0,200);
verticalGrad.addColorStop (0,'red');
verticalGrad.addColorStop (1,'green');
context.fillStyle = verticalGrad;
context.strokeStyle = 'yellow';
// Draw Figure 1
context.fillRect (25,25,100,150);
context.strokeText ("Fig 1",75,50);
context.strokeText ("State A", 75,125);
// Save State A
context.save();
// Settings for State B
var radGrad = context.createRadialGradient (375,100,5, 375,100,200);
radGrad.addColorStop (0,'orange');
radGrad.addColorStop (1,'yellow');
context.fillStyle = radGrad;
context.strokeStyle = 'green';
// Draw Figure 2
context.fillRect (175,25,100,150);
context.strokeText ("Fig 2",225,50);
context.strokeText ("State B",225,125);
// Save State B
context.save();
// Settings for State C
context.fillStyle = '#888888';
context.strokeStyle = '#EEEEEE';
// Draw Figure 3
context.fillRect (325,25,100,150);
context.strokeText ("Fig 3",375,50);
context.strokeText ("State C",375,125);
// Pop State C and restore State B
context.restore();
// Draw Figure 4
context.fillRect (475,25,100,150);
context.strokeText ("Fig 4",525,50);
context.strokeText ("State B",525,125);
// Pop state B and restore state A
context.restore();
// Draw Figure 5
context.fillRect (625,25,100,150);
context.strokeText ("Fig 5",675,50);
context.strokeText ("State A",675,125); save()
CanvasRenderingContext2D.save()push the current state on the state stack.
See the previous canvas for an example application.
restore()
CanvasRenderingContext2D.restore()remove the top state from the state stack and thus restore the previous state that was pushed on the state stack.
See the previous canvas for an example.
In general geometry, a transformation turns a given object into another object, but preserves its structure. Things may appear deformed, but they are not ruptured or destroyed. The absolute position of points may change, but the relative positions remain, neighboring points are still neighbors after the transformation.
Three special transformations can be called by special methods on the canvas context:
scale() resizes the canvas, rotate() turns it around the origin, and translate() shifts it to a new position. But actually, and different to what the three previous images suggest, not the canvas as an object in the brower window is moved by any of these operations, but rather its coordinate system is altered. Below we will demonstrate what that means in many examples.
Next to these three special tranformations, there are also the general transform() and setTransform() methods, which are more powerful, but also more difficult to comprehend and apply. 16 We also show, that any combination of transformations (e.g. first scaling, then a rotation, and finally scaling, again) is itself a transformation and can be performed with one transform() call. The other way round, this also implies, that we can decompose a complex transformation into simpler steps.
scale (x, y)
CanvasRenderingContext2D.scale (x, y)sets the width scaling factor to
xand the height factor toy, so that all sizes of the subsequently drawn objects are multiplied by these constants.xandyare (floating point) numbers.
Given a 200x200 pixel canvas, shown with a red border, and with a blue coordinate system (here, on top of the red border):
If we now call say scale(0.8,1.5), the horizontal x-axis shrinks by the factor 0.8 and the vertical y-axis extends by the factor 1.5. The same blue coordinate system on the red border canvas is this:
That means that all drawn picture elements after the call of scale(0.8,1.5) are now smaller in width and bigger in height, accordingly. Note however, that the size of the canvas has not changed. The picture in the browser is still everything that lies within the red border.
Let us take the same 200x200 pixel canvas again (the red border is generated with the additional attribute style="border: solid 3pt red" in the <canvas> tag). We add a green circle to the canvas context, which is done with this code
context.strokeStyle = 'green';        // set the color for the circle to 'green'
context.lineWidth = 5.0;              // set the lineWidth for the circle to 5.0
context.beginPath();                  // start a new path
context.arc (100,100,80,0,2*Math.PI); // a circle with center point (100,100) and radius 80
context.stroke();                     // draw the path; in this case only the circle
The browser picture of this canvas is this
But if we precede the previous code by the line
context.scale (0.8, 1.5); // shrink the x-coordinates by 0.8, extend the y-coordinates by 1.5then the picture will be this
The width is decreased by 0.8, the height of the circle is increased by the factor 1.5. The canvas has not changed in size, it still is a 200x200 pixel rectangular. As a result, the circle part that exceeds the canvas border, is cut off.
For example, this code
context.fillStyle = 'red';
context.strokeStyle = 'black';
context.font = '40px Arial';
// 1. draw a rectangle with text
context.fillRect (50, 50, 150, 40);
context.strokeText ('1. Hello', 55, 85);
// 2. scale and draw the same rectangle with text again
context.scale (0.8, 2);
context.fillRect (50, 50, 150, 40);
context.strokeText ('2. Hello', 55, 85);
// 3. scale once more, and make the same drawings
context.scale (0.8, 2);
context.fillRect (50, 50, 150, 40);
context.strokeText ('3. Hello', 55, 85);
generates this picture
First, we draw a rectangle by calling fillRect(50,50,150,40) and we insert a message with strokeText('1. Hello',55,85). Then we scale x by 0.8 and y by 2 and call the same fillRect(50,50,150,40), again. This second rectangle is inserted at (0.8*50,2*50) = (40,100), is 0.8*150 = 120 pixel wide and 2*40 = 80 pixel high. So in effect, the second scaled rectangle is the same as a call of fillRect(40,100,120,80) in the original coordinate system. But when we add the second message by calling strokeText('2. Hello',55,85) we also obtained a scaled message. And for that we really need the scale() method.
If we call
scale(x,y)with a negativex, the new coordinate system is mirrored at the y-axis. And ifyis negative, the new coordinate system is mirrored at the x-axis.
For example, let there be a 200x200 pixel canvas (the red frame), then the (blue) coordinate system after a call of scale(-1,1)is this:
If we take that 200x200 pixel canvas, then this script
context.scale (-1, 1);
context.fillStyle = 'green';
context.fillRect (-175, 70, 150, 60);
context.fillStyle = 'yellow';
context.fillRect (-170, 75, 140, 50);
context.fillStyle = 'green';
context.font = "40pt Arial";
context.fillText("Hello", -160, 120);
produces this picture:
Note, that the x-coordinates of all points inside the canvas are negative now. For example, we place the text at (-160,120) and it runs from right to left.
On the other hand, if we call scale(1,-1), we obtain a picture mirrored at the x-axis:
rotate (angle)
CanvasRenderingContext2D.rotate (angle)causes an
anglerotation of all subsequently drawn objects,anglebeing a (floating point) number.
Recall, that angles in this context are always defined in radians instead of degree. If you need a rotation of
ddegree, you can callrotate (d * Math.PI / 180);
Suppose we have a canvas, shown in red
If we call rotate(angle), all subsequently drawn objects are rotated by the given angle, according to the new blue coordination system. Note however, that the rendered canvas in the browser is still the red one, not the rotated blue one. Only the points that lie inside this blue canvas are visible.
More precisely, let us consider the default size (300x150 pixel) canvas that is rotated by 15 degree by calling rotate(15*Math.PI/180).
This is a picture of this canvas before the rotation with a yellow grid and the cross points like (50,50) written out
After the rotation by 15 degree, the same grid looks like this
For example, the point (250,100) has disappeared because it now falls outside the canvas, while (250,-50) now does exist.
This code snippet applies two subsequent rotations
context.fillStyle = 'red';
context.strokeStyle = 'black';
context.font = '40px Arial';
// 1. draw a rectangle with text
context.fillRect (100, 5, 150, 40);
context.strokeText ('1. Hello', 105, 40);
// 2. declare a rotation and draw the same rectangle with text again
context.rotate (30 * Math.PI / 180);                                      // first rotation of 30 degree
context.fillRect (100, 5, 150, 40);
context.strokeText ('2. Hello', 105, 40);
// 3. declare the same rotation, once more, and make the same drawings
context.rotate (30 * Math.PI / 180);                                      // second rotation of 30 degree
context.fillRect (100, 5, 150, 40);
context.strokeText ('3. Hello', 105, 40);
The generated picture is this
First, we draw the top horizontal rectangle with a "Hello" inside. We then rotate by 30 degree and draw the same rectangle and text, again. Note, that the coordinates are the same, i.e. fillRect(100,5,100,40). The second rectangle appears rotated below the first one. We then do a second rotation by 30 degree, followed by a third drawing of the rectangle and text. That generates the third rectangle, which is only half shown, because the other half is already outside the canvas.
translate (x, y)
CanvasRenderingContext2D.translate (x, y)moves the origin of the canvas
xpixels to the right andypixels down. Every new item after the call oftranslate(x,y)is added according to these new coordinates.
Suppose we have a canvas of say 250x150 pixel, displayed by the red frame and its blue coordinate system on top of it
After a call of translate (100,-50), this is the new coordinate system
In its original state and before the translation, the left upper corner has the coordinates (x,y) = (0,0)
After the translation, the left upper corner of the canvas is located ad (-100,50)
So, anything we put at say (200,100) does appear before, but not after the translation, anymore.
This code snippet
context.fillStyle = 'red';
context.strokeStyle = 'black';
context.font = '40px Arial';
// 1. draw the first red rectangle with text
context.fillRect (0,5,150,40);
context.strokeText ('1. Hello', 5, 40);
// 2. declare a translation and draw the same rectangle, again
context.translate(125,50);                                                 // first call of translate(125,50)
context.fillRect (0,5,150,40);
context.strokeText ('2. Hello', 5, 40);
// 3. declare the same translation, once more, and make the same drawings
context.translate(125,50);                                                 // second call of translate(125,50)
context.fillRect (0,5,150,40);
context.strokeText ('3.Hello', 5, 40);
generates this picture
First, a rectangle is drawn by calling fillRect(0,5,150,40) and text is added with strokeText('1. Hello',5,40). Then, translate(125,50) is called and the same rectangle is drawn again with fillRect(0,5,150,40). Since the origin has moved, this second rectangle is also moved 125 pixels to the right and 50 pixels downwards. Finally, translate(125,50) is called once more, causing the origin to move, again. And when the rectangle is also drawn again with fillRect(0,5,150,40), a third rectangle appears to the right and below the two previous ones. Note, that all content outside the canvas is cut off, the third rectangle is not fully displayed.
transform (a, b, c, d, e, f)
CanvasRenderingContext2D.transform (a, b, c, d, e, f)
is the general method to perform an affine transformation. Each point(x,y)is transformed into the new point(x',y'), where
x' = a*x + c*y + e
y' = b*x + d*y + f
The effect of the single parameters on the outcome is as follows:
| Parameter | Effect |
|---|---|
a |
scales horizontally (and mirrors at the y-axis for negative a) |
b |
skews horizontally |
c |
skews vertically |
d |
scales vertically (and mirrors at the x-axis for negative a) |
e |
moves horizontally |
f |
movew vertically |
Consider a default size (i.e. 300x150 pixel) canvas, given by a red frame, with a blue coordinate grid on top:
After a transformation of say
transform (0.5, 0.4, -0.2, 1.2, 200, 0)the new coordinate system is this
And if we populate this canvas context before and after the same transformation by running this code
// prepare the settings for color and font styles
context.fillStyle = 'red';
context.strokeStyle = 'black';
context.font = '40px Arial';
// 1. draw the first red rectangle with text
context.fillRect (0, 5, 150, 40);
context.strokeText ('1. Hello', 5, 40);
// 2. declare the translation and draw the same rectangle, again
context.transform (0.5, 0.4, -0.2, 1.2, 200, 0);
context.fillRect (0, 5, 150, 40);
context.strokeText ('2. Hello', 5, 40);
then this is the resulting picture:
scale(), rotate() and translate() in terms of transform()
transform(), together with the similar setTransform(), is the general method to perform (affine) transformations. scale(), rotate() and translate() are just special versions of transform() with less parameters. The following table shows the exact implementations:
| special transformation |
same transformation in terms of transform()
|
|---|---|
scale(x,y)
|
transform (x, 0, 0, y, 0, 0)
|
rotate(angle)
|
transform (c, s, -s, c, 0, 0) where c = Math.cos(angle) and s = Math.sin(angle)
|
translate(x,y)
|
transform (1, 0, 0, 1, x, y)
|
So instead of calling say
context.scale (0.8, 1.5);we achieve the same effect with a call of
context.transform (0.8, 0, 0, 1.5, 0, 0);Certain special rotations are these:
| rotation |
in terms of rotate()
|
same transformation in terms of transform()
|
|---|---|---|
90 degree
|
rotate(Math.PI/2)
|
translate(0,1,-1,0,0,0)
|
180 degree
|
rotate(Math.PI)
|
translate(-1,0,0,-1,0,0)
|
270 degree
|
rotate(1.5*Math.PI)
|
translate(0,-1,1,0,0,0)
|
shear() transformation
Another special transformation, one that is not pre-defined in the CanvasRenderingContext2D API, is
shear(x,y)which is simpley an abbreviation17 for
transform (1, y, x, 1, 0, 0)For example,
shear(0.5,0) is this transformation:
shear(0,0.2) is
shear(0.5,0.2) is
setTransform (a, b, c, d, e, f)
CanvasRenderingContext2D.setTransform (a, b, c, d, e, f)
works liketransform(), but instead of transforming the current transformation, it is performed on the initial identity transformation.
Initially, every canvas context has the initial coordinate system, as described in the introduction. After every transformation, this coordinate system is changed to a new current system. With each tranform() call, this current system is transformed, again. A call of setTransform() however does not transform the current system, but starts from the initial one.
In standard jargon, we rather talk about "transformation" again instead of "coordinate system", so there is an initial transformation (namely the distinguished identity transformation) and a current transformation.
Let us start again with a broader view on how everything is connected together and implemented. It might help or hinder to explain the underlying mathematics, so we isolated this as optional information into a small digression and its footnotes.
Digression: The algebra of (affine) transformationsA transformation
τis uniquely determined and represented 18 by six numeric parameters(a,b,c,d,e,f)and defines a function, that maps given points(x,y)to new points(x',y') = τ(x,y)and where the mapping is defined byx' = a*x + c*y + eandy' = b*x + d*y + f.If
τ1andτ2are two transformations, then their compositionτ1⊗τ2is defined as the function, that maps each points(x,y)to the new pointτ2(τ1(x,y)). It turns out, that the composition functionτ1⊗τ2is also a well-defined transformation, again. Transformations are closed under composition.More precisely, this is saying that there is also a well-defined composition
⊗on parameter tuples. 19
If(a1,b1,c1,d1,e1,f1)is a representation for the transformationτ1and(a2,b2,c2,d2,e2,f2)forτ2, and if
(a1,b1,c1,d1,e1,f1) ⊗ (a2,b2,c2,d2,e2,f2)=(a3,b3,c3,d3,e3,f3)then
(a3,b3,c3,d3,e3,f3)is the (unique and well-defined) representation ofτ1⊗τ2.The identity transformation is the transformation
id, that maps each point(x,y)onto itself,id(x,y)=(x,y). This immediately implies thatid ⊗ τ=τ ⊗ id=τ, for every transformationτ.It is easy to verify, that the parameter representation of
idis given by(1,0,0,1,0,0).
At every point in time, right from its creation, the canvas context has property called the current transformation. It might help here to read "current coordinate sytem" instead of "current transformation". And that makes sense really: when the canvas is rendered in the browser, the picture components are placed into the canvas area according to the given current transformation or _coordinate system.
In the [WHATWG] standard, each CanvasRenderingContext2d still had this current transformation explicitly available as the currentTransform property.20 But in the final standard of [W3C], this property has vanished and is no longer accessible.
The initial coordinate system, the one at the time of the context creation, is the one with the origin (0,0) at the left top corner point and the orthogonal x- and y-axis, as described in the introduction. The initial transformation is in fact the identity transformation id.
Each time, a new transformation τ' is issued in the script by a transform() call (or any of its special versions scale(), rotate() or translate()), the current transformation τ is replaced by the new current transformation τ⊗τ'. And this step is repeated after each new transformation.
And with a call of setTransform(), the current transformation is not set to τ⊗τ', but to the new transformation τ' itself (as it is defined by the six parameters of the setTransform(a,b,c,d,e,f) call).
The [WHATWG] standard also knew a resetTransform() method, that explicitly set the current transformation to the identity id. But again, this has been removed from the final [W3C] version. But of course, the same effect of a resetTransform() call can be achieved with a setTransform(1,0,0,1,0,0) call, which also sets the current transformation back to the identity id.
Suppose, we want to write "HELLO!" on a canvas, but in a vertical text box, like so
A similar problem is this: How do we turn the coordinate system of a canvas, say
onto its left side
The answer to the latter problem is this: First, rotate by 270 degree by calling rotate(1.5*Math.PI)
and secondly, move the coordinate grid down the x-axis so that (0,0) is located at the left lower corner, by calling translate(-h,0), with h being the height of the canvas, here 150.
So, back to the original problem of the vertical text, we have a 300x255 pixel canvas and then call
context.rotate (1.5*Math.PI);  // rotation of 270 degree
context.translate (-255,0);    // move the coordinate system down along the x-axis by 255 pixel
which gives us
We then draw the text box by calling
context.fillStyle = 'red';
context.fillRect (0, 0, 255, 120);
context.fillStyle = 'yellow';
context.fillRect (5, 5, 245, 110);
context.fillStyle = 'red';
context.font = "50pt Arial";
context.lineWidth = 5.0;
context.fillText ("HELLO!", 10, 85);
so that the full result is as expected:
We just performed a rotation and a translation, but we can also merge the two transformation steps into a single one.
Recall that
rotate(1.5*Math.PI) is the same as transform(c,s,-s,c,0,0) with c = Math.cos(1.5*Math.PI) = 0 and s = Math.sin(1.5*Math.PI) = -1. In other words, a rotation by 270 degree is performed with a transform(0,-1,1,0,0,0) call.
translate(h,0) is the same as transform(1,0,0,1,h,0)
(0,-1,1,0,0,0) ⊗ (1,0,0,1,h,0) = (0,-1,1,0,h,0)
Alltogether, that means that
context.rotate(1.5*Math.PI);
context.translate(h,0);
is the same as
context.transform(0,-1,1,0,0,0);
context.transform(1,0,0,1,h,0);
and that has the same effect as the composition
context.transform(0,-1,1,0,h,0);Let us continue the previous example of the vertical text box. There was some space left on the canvas and we are going to insert a mirror image there. This shall be the result:
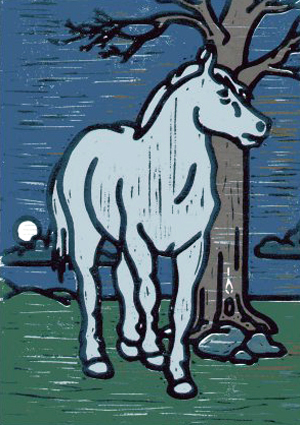
The image is a mirror image, because in the original image, the horse is looking to the other side:
In the explanation of scale() we already mentioned that a mirror image at the y-axis can be achieved by a scale(-1,1) call. We let this be followed by translate(-w,0) call, where the width w = 300, so that the overall transformation22 is now given by this coordinate system
In this transformed canvas context, we now insert the image at (0,0) with an assigned width of 180 and height of 255 pixel. The code is this
context.scale (-1, 1);
context.translate(-300,0);
var image = new Image();
image.src = "horse.jpg";
context.drawImage (image, 0, 0, 180, 255);
and this is the resulting browser picture
So, by now we have the code for the two parts of the final picture
First, there is the text on the left, generated by
// 1. The vertical text box
// 1.a) Two transformations: first a rotation, then a translation
context.rotate (1.5 * Math.PI);
context.translate (-255,0);
// 1.b) The code for the text box
context.fillStyle = 'red';
context.fillRect (0, 0, 255, 120);
context.fillStyle = 'yellow';
context.fillRect (5, 5, 245, 110);
context.fillStyle = 'red';
context.font = "50pt Arial";
context.lineWidth = 5.0;
context.fillText ("HELLO!", 10, 85);
and then there is the image on the right, generated by
// 2. The mirror image of the horse
// 2.a) Two transformations: first mirror at the y-axis, then a translation
context.scale (-1, 1);
context.translate (-300,0);
// 2.b) Insert the image
var image = new Image();
image.src = "horse.jpg";
context.drawImage (image, 0, 0, 180, 255);
But if we add both code snippets together, we would get this unexpected result:
The reason is, that the two transformations for the image are performed on the two transformations for the text box. In other words, calls of transform(), scale(), rotate() and translate() alter the current transformation, which may be different from the default initial identity transformation. What we need to do before the second part is a reset of the current transformation to the identity tranformation. As mentioned, the CanvasRenderingContext2D object used to have a resetTransform() to do just that. But in the final standard, there is only the setTransform() method left. Recall, that the identity transformation is given by the parameters (1,0,0,1,0,0), so calling setTransform(1,0,0,1,0,0) resets the current transformation parameters. The code for the whole canvas is this given by
// 1. The vertical text box
// ...
// Reset the current transformation
context.setTransform (1,0,0,1,0,0);
// 2. The mirror image of the horse
// ... globalAlpha
CanvasRenderingContext2D.globalAlphadetermines the current α (alpha or transparency) value for the drawings. This α value is a float number between
0.0(for fully transparent) and1.1(for fully opaque). The default value is1.0, which means that all drawn items are not transparent, at all.
Let us demonstrate the the effect on a canvas with four rectangles, generated by the following code template:
<canvas id="GlobalAlphaSample" width=470 height=180 style="border: solid 1pt blue"> </canvas>
<script>
  var context = document.getElementById('GlobalAlphaSample').getContext('2d');
  // 1. setting alpha
  context.globalAlpha = "...";     // THIS IS THE IMPORTANT LINE!!!!!!!!!!!!!!!!!!!!
  // 2. set the text style
  context.font = '20px Arial'; context.strokeStyle = 'black';
  // 3. draw the four rectangles
  context.fillStyle = 'red';     context.fillRect( 10,10,150,100);  context.strokeText('red',    20, 50);
  context.fillStyle = 'green';   context.fillRect(110,30,150,100);  context.strokeText('green', 120, 80);
  context.fillStyle = 'yellow';  context.fillRect(210,50,150,100);  context.strokeText('yellow',220,110);
  context.fillStyle = 'blue';    context.fillRect(310,70,150,100);  context.strokeText('blue',  320,140);
</script>
where we each time insert another α value for the "..." part.
Setting context.globalAlpha = 1.0 produces this:
Of course, this value 1.0 is the default α value, so we could have omitted the whole line of code and would still have obtained the same result.
Setting context.globalAlpha = 0.5 however now gives us this:
And finally, context.globalAlpha = 0.1 does this:
globalCompositeOperation
CanvasRenderingContext2D.globalCompositeOperationdetermines how a new ("source") image is displayed against an existing ("destination") image. Possible values are
source-over,source-atop,source-in,source-out,destination-over,destination-atop,destination-in,destination-out,xorandcopy. Default issource-over. Unknown values are ignored.
Suppose we first draw an orange square and then a cyan circle. In this composite operation we refer to the already existing square as the destination, and the new circle is called the source of the composition.
If the circle coincides with the square, it is put over the square by default, i.e. it is diplayed as "source-over-destination" or "source-over". But we might as well alter this behavior and set globalCompositeOperation to say "destination-over", in which case the circle is displayed under the square, i.e. the destination square is over the source circle.
The previous canvas was generated by this code:
<canvas id="GlobalCompositeSample" width=90 height=90 style="border: solid 1pt green"> </canvas>
<script>
  var context = document.getElementById('GlobalCompositeSample').getContext('2d');
  // 1. add the orange square
  context.fillStyle = 'orange';
  context.fillRect (0, 0, 60, 60);
  // 2. set the globalCompositeOperation
  context.globalCompositeOperation = "source-over";
  // 3. add the cyan circle
  context.fillStyle = 'cyan';
  context.arc(54,54,36,0,2*Math.PI,false);
  context.fill();
</script>
and we generate the examples in the table below essentially by replacing "source-over" by the according alternative value.
"source-over" (default) Displays the source image over the destination image. |
"source-atop" Displays the source on top of the destination image. The part of the source image outside the destination image is not shown. |
"source-in" Displays the source in the destination image, i.e. only the part of the source inside the destination is shown and the destination is transparent. |
"source-out" Only displays the part of the source image that is outside the destination, which is made transparent. |
"destination-over" Displays the destination over the source image. |
"destination-atop" Displays the destination on top of the source image. The part of the destination image that is outside the source is not shown. |
"destination-in" Only displays the part of the destination that is inside the source image, which is made transparent. |
"destination-out" Only displays the part of the destination that is outside the source image, which is made transparent. |
"lighter" Displays the source together with the destination image, the overlapping area is rendered lighter. |
"copy" Ignores the destination and just displays the source image. |
"xor" Only the areas that exclusively belong either to the destination or the source are displayed. Overlapping parts are ignored. |
Opposite to the lighter value, some earlier browsers also supported darker. But this value is not part of the official canvas specification.
strokeStyle and fillStyle are context properties that hold the style value for the subsequently drawn stroke or filled objects, respectively.
There are three kinds of possible style values: CSS colors, (linear or radial) gradients, and patterns.
A CSS color (see CSS colors below) is e.g. one of the color names (such as 'green' or 'aqua') or a hexadecimal color (e.g. '#00FF00'). If we want the following filled objects to be green, we set the canvas property with say
context.fillStyle = '#008000';or alternatively and with the same effect, using a color name instead of the hexadecimal color value
context.fillStyle = 'green';A gradient can be created to define colors that are not constant, but gradually change on the area. If we want to set the style this way, we first need to create an object that implements the opaque CanvasGradient interface, which allows us to call the addColorStop() method. In our script, we therefore need to do
var myNewGradient = context.createLinearGradient (...);   // 1. create a linear gradient
myNewGradient.addColorStop (...);                         // 2. set a color in the gradient vector field
myNewGradient.addColorStop (...);                         //    add yet another color; as many as you like
context.fillStyle = myNewGradient;                        // 3. finally, let the gradient be new style from now on
The same method goes for radial instead of linear gradients and stroke instead of fill style, and the details should become clear in the explanations for the linear and radial gradient below.
A pattern takes a given image and repeats that throughout the canvas. Drawn objects then show this pattern instead of say a monochrome color. The according method to achieve this is
createPattern (image, repetition)strokeStyle
CanvasRenderingContext2D.strokeStyleholds the style value for stroke objects, which is either a CSS color, a gradient or a pattern (as explained in the introduction). The default style value is
'black'.
In the following example we first set the strokeStyle to a green color value.
<canvas id="StrokeStyleSample1" width=320 height=120> </canvas>
<script>
  var context = document.getElementById('StrokeStyleSample1').getContext('2d');
  // 1. set strokeStyle to a hexadecimal color value, namely '#008000' (same as 'green')
  context.strokeStyle = '#008000';
  // 2. draw a kind of half cirlce on the left
  context.beginPath();
  context.moveTo (60, 10);
  context.lineTo (60, 110);
  context.bezierCurveTo (0, 110, 0, 10, 60, 10);
  context.stroke();
  context.closePath();
  // 3. draw a rectangle on the right top
  context.strokeRect (80, 10, 230, 30);
  // 4. set the text font and write 'Hello!' on the right bottom of the canvas
  context.font = '60pt sans-serif';
  context.strokeText ('Hello!', 80, 110);
</script>
After the strokeStyle value is set, all stroke objects (drawn with stroke(), strokeRect(), and strokeText()) are colored accordingly. The previous code snippet renders like this:
fillStyle
CanvasRenderingContext2D.fillStyleholds the style value for filled objects. Again (as explained in the introduction), possible values are CSS colors, a gradient or a pattern. The default value is
'black'.
As in the previous example, we again set the fillStyle value to a green color value.
<canvas id="FillStyleSample1" width=320 height=120> </canvas>
<script>
  var context = document.getElementById('FillStyleSample1').getContext('2d');
  // 1. set strokeStyle to a hexadecimal color value, namely '#008000' (same as 'green')
  context.fillStyle = '#008000';
  // 2. draw a kind of half cirlce on the left
  context.beginPath();
  context.moveTo (60, 10);
  context.lineTo (60, 110);
  context.bezierCurveTo (0, 110, 0, 10, 60, 10);
  context.fill();
  context.closePath();
  // 3. draw a rectangle on the right top
  context.fillRect (80, 10, 230, 30);
  // 4. set the text font and write 'Hello!' on the right bottom of the canvas
  context.font = '60pt sans-serif';
  context.fillText ('Hello!', 80, 110);
</script>
The filled objects (drawn in step 2-4 with fill(), fillRect() and fillText()) now appear green:
createLinearGradient (x0, y0, x1, y1) and addColorStop (pos, color)
CanvasRenderingContext2D.createLinearGradient (x0, y0, x1, y1)creates a
CanvasGradientobject that defines a linear gradient running from starting point(x0,y0)to end point(x1,y1).
CanvasGradient.addColorStop (position, color)then assigns a
colorat the givenposition. Thispositionis a value between0.0(starting point of the linear gradient) and1.0(end point). Thecoloris a string representing a CSS color.The
CanvasGradient(with added colors) can then be defined as a style value tostrokeStyleorfillStyle.
A typical example of a "gradient" color style is a rainbow, gradually changing its color. So let us create a linear gradient, we name it rainbowGradient, add some colors, assign that to fillStyle and then draw a fillRect() over the size of the whole canvas. The resulting picture is this:
and the original code snippet to generate that picture is given by
<canvas id="Rainbow1" width=600 height=100> </canvas>
<script>
  var context = document.getElementById('Rainbow1').getContext('2d');
  // 1. create the linear gradient
  var rainbowGradient = context.createLinearGradient (100, 50, 500, 50);
  // 2. add colors to the gradient
  rainbowGradient.addColorStop (0,    'red');
  rainbowGradient.addColorStop (0.25, 'yellow');
  rainbowGradient.addColorStop (0.5,  'green');
  rainbowGradient.addColorStop (0.75, 'blue');
  rainbowGradient.addColorStop (1,    'violet');
  // 3. set the fillStyle to this new gradient
  context.fillStyle = rainbowGradient;
  // 4. now draw some filled objects; in this case just a rectangle
  context.fillRect (0, 0, 600, 100);
</script>The whole process is more complicated than just assigning a color (say 'green') to fillStyle. Instead, we take the following steps:
By calling
var rainbowGradient = context.createLinearGradient (100, 50, 500, 50);we create a linear gradient (named rainbowGradient) from starting point (100,50) to end point (500,50).
That is indicated by the line in the middle of the canvas.
In the next step we add five colors to the gradient by calling
rainbowGradient.addColorStop (position, color);five times.
Each time, position is a value between 0 and 1, which is the relative distance between the start and end point. Instead of color names 'red', 'yellow' etc. we could have taken any CSS color string.
In the third step, we assign this newly created linear gradient as a value to fillStyle
context.fillStyle = rainbowGradient;and when we then draw any filled objects, these objects are colored according to the rainbowGradient specification.
In our example, we only draw a fillRect() over the size of the whole canvas, which makes the whole gradient setting visible.
The whole process also works for multiple objects and for strokeStyle instead of fillStyle. To demonstrate this, look at this canvas
generated by this code (steps 2.-4. are identical to the strokeStyle example code):
<canvas id="RainbowStrokeStyleSample1" width=320 height=120> </canvas>
<script>
  var context = document.getElementById('RainbowStrokeStyleSample1').getContext('2d');
  // 1. set strokeStyle to a linear gradient value
  var rainbowGradient = context.createLinearGradient (0, 60, 320, 60);
  rainbowGradient.addColorStop (0,    'red');
  rainbowGradient.addColorStop (0.25, 'yellow');
  rainbowGradient.addColorStop (0.5,  'green');
  rainbowGradient.addColorStop (0.75, 'blue');
  rainbowGradient.addColorStop (1,    'violet');
  context.strokeStyle = rainbowGradient;
  // 2. draw a kind of half cirlce on the left
  context.beginPath();
  context.moveTo (60, 10);
  context.lineTo (60, 110);
  context.bezierCurveTo (0, 110, 0, 10, 60, 10);
  context.stroke();
  context.closePath();
  // 3. draw a rectangle on the right top
  context.strokeRect (80, 10, 230, 30);
  // 4. set the text font and write 'Hello!' on the right bottom of the canvas
  context.font = '60pt sans-serif';
  context.strokeText ('Hello!', 80, 110);
</script>createRadialGradient (x0, y0, r0, x1, y1, r1) and addColorStop (pos, color)
CanvasRenderingContext2D.createRadialGradient (x0, y0, r0, x1, y1, r1)creates a
CanvasGradientobject that defines a radial gradient running from a starting circle(x0,y0,r0)to the end circle(x1,y1,r1). In each of the two circles(x,y,r), the center point is(x,y)and the radius isr, wherex,yandrare (floating point) numbers.
CanvasGradient.addColorStop (position, color)then assigns a
colorat the givenposition. Thispositionis a value between0.0(starting point of the linear gradient) and1.0(end point). Thecoloris a string representing a CSS color.The newly generated
CanvasGradientcan then be defined as a style value tostrokeStyleorfillStyle.
The setup of the radial gradient is similar to the linear gradient, except that the gradient field is not linear, from a starting point (x0,y0) to an end point (x1,y1). Instead its origin is a circle (x0,y0,r0) and that moves towards an end circle (x1,y1,r1).
With a radial gradient we can create 3D effects like turning a monochrome red disk into a ball, illuminated by a light source:
This picture is created by the following code
<canvas id="RadialSample" width=240 height=240> </canvas>
<script>
  var context = document.getElementById('RadialSample').getContext('2d');
  // 1. create a radial gradient
  var rg = context.createRadialGradient (80, 80, 20, 120, 120, 110);
  // 2. add colors
  rg.addColorStop (0, 'yellow');
  rg.addColorStop (1, 'red');
  // 3. set the fill style to the new gradient
  context.fillStyle = rg;
  // 4. now draw some filled objects; in this case just a circle
  context.beginPath();
  context.arc (120,120,110,0,2*Math.PI,false);
  context.fill();
  context.closePath();
</script>
The steps are as follows:
We start with the creation of a radial gradient, calling it rg
var rg = context.createRadialGradient (80, 80, 20, 120, 120, 110);The arguments of this call are the parameters for two cicles: The start circle (x0,y0,r0) = (80,80,20) with center point (80,80) and radius 20, and the end circle (x1,y1,r1) = (120,120,110).
The process from gradually changing from start circle into end circle can again be numbered into a continuous process from position 0.0 to position 1.0.
For example, the five positions 0.0, 0.25, 0.5, 0.75 and 1.0 are
We now add color stops to the radient. In our case, just 'yellow' at start position 0.0 and 'red' at end position 1.0
rg.addColorStop (0, 'yellow');
rg.addColorStop (1, 'red');
The gradient rg is now assigned as a style value to fillStyle
context.fillStyle = rg;so that all subsequently drawn filled objects take this "color" rg.
We finally draw filled objects, in this example just one filled circle, which covers exactly the end circle of the radial gradient
context.beginPath();
context.arc (120,120,110,0,2*Math.PI,false);
context.fill();
context.closePath();If we would have drawn a filled rectangle over the size of the whole canvas instead of the circle, i.e. if this one line
context.fillRect (0, 0, 240, 240);would replace the code in the previous step 4, then the picture is this
If we then replace the colors 'yellow' by 'white' and 'red' by 'black', we obtain
And finally, if we not only add two color stops, but these five one instead
  rg.addColorStop (0, 'red');
  rg.addColorStop (0.25, 'yellow');
  rg.addColorStop (0.5, 'green');
  rg.addColorStop (0.75, 'blue');
  rg.addColorStop (1, 'violet');
the picture becomes
It is probably important to exercise a lot of examples in order to handle the gradients. The following example shows variations of the start and end circle of the radial gradient. Each time, we use this code template:
<canvas id="RadialGradient1" width=200 height=200> </canvas>
<script>
  var context = document.getElementById('RadialGradient1').getContext('2d');
  context.addGrid();
  var rainbowGradient = context.createRadialGradient (x0, y0, r0, x1, y1, r1);
  rainbowGradient.addColorStop (0, 'orange');
  rainbowGradient.addColorStop (1, 'cyan');
  context.fillStyle = rainbowGradient;
  context.fillRect (0, 0, 200, 200);
</script>
and in each concrete example, the six parameters in context.createRadialGradient (x0, y0, r0, x1, y1, r1) are varied. The first picture in each column shows how the canvas is rendered. The second picture shows the location of the orange start and the cyan end circle.
(x0,y0,r0,x1,y1,r1)=(100,100,10,100,100,75)
|
(x0,y0,r0,x1,y1,r1)=(80,80,10,120,120,75)
|
(x0,y0,r0,x1,y1,r1)=(50,50,50,150,150,50)
|
(x0,y0,r0,x1,y1,r1)=(30,30,10,150,150,50)
|
createPattern (image, repetition)
CanvasRenderingContext2D.createPattern (image, repetition)returns a
CanvasPatternobject, which can be used as a value for a style property (seefillStyleandstrokeStyle).
Theimageargument must be aHTMLImageElement, aHTMLVideoElementor anotherHTMLCanvasElement.
Therepetitionargument must be one of the following values:'repeat-x'(for horizontal repetition of the image),'repeat-y'(for vertical repetition of the image),'repeat'(for both horizontal and vertical repetition), or'no-repeat'(for neither repetition). The default value is'repeat'.
Actually, in Firefox, 'repeat' is the only accepted value for repetition, at all.
For example, let us use the 49×70 pixel size JPG file grayhorse.jpg

as a pattern image for a CanvasPattern object and use this object as a value for the fillStyle property. Subsequently, we draw some filled objects: with fillRect(), a fill() path, and some fillText(). The full code snippet
<canvas id="CreatePatternSample1" width=600 height=210> </canvas>
<script>
  var context = document.getElementById('CreatePatternSample1').getContext('2d');
  // create an Image object from the grayhorse.jpg file
  var horseImage = new Image ();
  horseImage.src = 'grayhorse.jpg';
  // create a CanvasPattern object with this image and make that the new fillStyle value
  var horsePattern = context.createPattern (horseImage, 'repeat');
  context.fillStyle = horsePattern;
  // Now draw same objects: first a rectangle
  context.fillRect (0, 0, 200, 210);
  // then a triangle
  context.beginPath();
  context.moveTo (220, 0);
  context.lineTo (220, 100);
  context.lineTo (550, 50);
  context.lineTo (220, 0);
  context.fill();
  context.closePath();
  // and finally write "Hello!"
  context.font = '120px sans-serif';
  context.fillText ('Hello!', 210, 200);
</script>
renders in your browser like so
Next to the general style settings there are special style properties defining the rendering of lines, their caps and joins, namely lineWidth, lineCap and lineJoin. And to limit the tips of pointed angles, there is also miterLimit.
lineWidth
CanvasRenderingContext2D.lineWidthholds a float number defining the current line thickness (in coordinate space units). The default value is
1.0.
The following canvas shows different lineWidth settings from 0.1 to 20.0. In each line example, we first set context.lineWidth to the according number and then draw the line.
Note, that all lines are drawn with strokeStyle set to (default) 'black', but that many lines appear more gray than black, and their edges are not very crisp. This is not a browser bug, but has to do with the fact that the canvas is decomposed into pixels. If a say black line or shape covers a white pixel only partially, the actual color of that pixel is a medium gray value.
In the following enlarged canvas example, a line from (0, 2) to (10, 2) covers 20 half pixels. These affected pixels are therefore rendered gray. The line from (0, 1.5) to (10, 1.5) on the other hand fully fits into the affected ten pixels, the line is rendered crisp and black.
lineCap
CanvasRenderingContext2D.lineCapdefines the style of line endings. Possible values are
'butt','round'or'square'. The default is'butt'.
In the following example, we draw three times three lines from the top to the bottom orange line. The lineWidth is set to 5.0, 10.0, and 20.0, respectively. The lineCap is set to 'butt', 'round' and 'square', as explained in the picture. Note, that the lines with the round and square line caps exceed their ending points by half of the line width.
lineJoin
CanvasRenderingContext2D.lineJoindefines the style of lines at their meeting point. Possible values are
'round','bevel'or'miter'. The default is'miter'.
The following three canvas examples each draw the same sequence of lines, except that each time the lineJoin property is set to the according value before the lines are drawn.
miterLimit
CanvasRenderingContext2D.miterLimitThe miter length is the distance from the point where the join of two lines occurs to the intersection of the line edges on the outside of the join. The miter limit ratio, set by
miterLimitwith default value10.0, is the maximum allowed ratio of the miter length to half the line width. If the miter length would cause the miter limit ratio to be exceeded, the corner will be displayed as iflineJoinis set tobevel.
The CanvasRenderingContext2D comes with nice tools to add fancy shadows to all the objects in the canvas, even to text. There are four properties that determine the presence and appearance of shadows: shadowOffsetX, shadowOffsetY, shadowBlur and shadowColor.
It makes sense to think that all objects added to the context have shadows. Except these shadows are invisible in the default setting, because then shadowOffsetX and shadowOffsetY are set to 0, shadowBlur is 0 and the shadowColor is transparent.
The following example canvas shows three columns, each one with different shadow settings. The first column #1 shows the default case, #2 has a crisp orange shadow, and in column #3, the shadows are blurred and half transparent black.
The source code for the just show canvas is this
<canvas id="ShadowSample0" width=600 height=330 style="border: solid 1pt blue;"> </canvas>
<script>
  var context = document.getElementById("ShadowSample0").getContext("2d");
  // General settings
  context.font = '40pt Arial';               // sets the font
  context.lineWidth = '5'                    // sets the line width for the strokeRect() calls below
  context.strokeStyle = 'green'              // sets the color for the strokeRect() calls below
  context.fillStyle = 'red';                 // sets the color for the fillText() and fillRect() calls below
  // #1 column with default (= no) shadow
  context.fillText ("# 1", 25, 45);
  context.fillRect (25, 70, 100, 100);
  context.strokeRect (25, 200, 100, 100);
  // #2 column
  context.shadowOffsetX = 15;                // shadow appears 15 pixel to the right
  context.shadowOffsetY = 15;                // shadow appears 15 pixel to the botttom
  context.shadowColor = 'orange';            // shadow color now is 'orange'
  context.shadowBlur = 0;                    // zero blur: this is a crisp shadow
  context.fillText ("# 2", 225, 45);
  context.fillRect (225, 70, 100, 100);
  context.strokeRect (225, 200, 100, 100);
  // #3 column
  context.shadowOffsetX = 15;                // again, lets shadows appear 15 pixel to the right
  context.shadowOffsetY = 15;                // ... and 15 pixel to the bottom
  context.shadowColor = 'rgba(0,0,0,0.5)';   // shadow color is black, but half transparent
  context.shadowBlur = 5;                    // shadow is blurred
  context.fillText ("# 3", 425, 45);
  context.fillRect (425, 70, 100, 100);
  context.strokeRect (425, 200, 100, 100);
</script>shadowOffsetX
CanvasRenderingContext2D.shadowOffsetXholds a float number to define the shadow offset in the horizontal direction. By default it is set to
0.
Here is an example with four different shadowOffsetY values:
In #1 the shadowOffsetX is default 0: there is no shadow, as it is directly behind the text characters. In #2 the horizontal offset is set to 10 before the text is written, so it appears ten pixel to the right behind the text. In #3 and #4 the shadowOffsetX is -15 and 75, respectively. The source code for all this is
<canvas id="ShadowOffsetXSample" width=650 height=60 style="border: solid 1pt blue;"> </canvas>
<script>
  var context = document.getElementById("ShadowOffsetXSample").getContext('2d');
  // settings for the use of fillText below
  context.fillStyle = 'black';
  context.font = '40pt Arial';
  // set the shadow color to a visible 'orange'
  context.shadowColor = 'orange';
  // #1 text with horizontal shadow offset 0 (i.e. shadow behind the text and thus invisible)
  context.shadowOffsetX = 0;
  context.fillText ("#1",  50, 50);
  // #2 text with horizontal shadow offset 10 (i.e. 10 pixel to the right)
  context.shadowOffsetX = 10;
  context.fillText ("#2", 200, 50);
  // #3 text with horizontal shadow offset -10 (i.e. 10 pixel to the left)
  context.shadowOffsetX = -10;
  context.fillText ("#3", 350, 50);
  // #4 text with horizontal shadow offset 75 (i.e. 75 pixel to the right)
  context.shadowOffsetX = 75;
  context.fillText ("#4", 500, 50);
</script>shadowOffsetY
CanvasRenderingContext2D.shadowOffsetYholds a float number to define the shadow offset in the vertical direction. By default it is set to
0.
Here is an example with four different shadowOffsetY values, set to default 0, 10, -10 and 75, respectively:
The source code for the previous example is this:
<canvas id="ShadowOffsetYSample" width=650 height=130 style="border: solid 1pt blue;"> </canvas>
<script>
  var context = document.getElementById("ShadowOffsetYSample").getContext('2d');
  // settings for the use of fillText below
  context.fillStyle = 'black';
  context.font = '40pt Arial';
  // set the shadow color to a visible 'orange'
  context.shadowColor = 'orange';
  // #1 text with vertical shadow offset 0 (i.e. shadow behind the text and thus invisible)
  context.shadowOffsetY = 0;
  context.fillText ("#1",  50, 50);
  // #2 text with vertical shadow offset 10 (i.e. 10 pixel down)
  context.shadowOffsetY = 10;
  context.fillText ("#2", 200, 50);
  // #3 text with vertical shadow offset -10 (i.e. 10 pixel up)
  context.shadowOffsetY = -10;
  context.fillText ("#3", 350, 50);
  // #4 text with vertical shadow offset 75 (i.e. 75 pixel down)
  context.shadowOffsetY = 75;
  context.fillText ("#4", 500, 50);
</script>shadowBlur
CanvasRenderingContext2D.shadowBlurholds a float number to define the current level of blur applied to shadows. By default it is set to
0.
The following example shows the shadow for four different blur levels, namely default 0, 2, 4 and 8, respectively:
The source code for the previous example is this:
<canvas id="ShadowBlurSample1" width=650 height=70 style="border: solid 1pt blue;"> </canvas>
<script>
  var context = document.getElementById("ShadowBlurSample1").getContext('2d');
  // settings for the use of fillText below
  context.fillStyle = 'black';
  context.font = '40pt Arial';
  // set the shadow color to a visible 'orange' and the x- and y-offset to 15
  context.shadowColor = 'orange';
  context.shadowOffsetX = 15;
  context.shadowOffsetY = 15;
  // #1
  context.shadowBlur = 0;
  context.fillText ("#1",  50, 50);
  // #2
  context.shadowBlur = 2;
  context.fillText ("#2", 200, 50);
  // #3
  context.shadowBlur = 4;
  context.fillText ("#3", 350, 50);
  // #4
  context.shadowBlur = 8;
  context.fillText ("#4", 500, 50);
</script>
Even if shadowOffsetX and shadowOffsetY are both 0 so that the shadow is directly behind the drawn objects, it still creates a visible effect when shadowBlur has a positive value, say 5, as in the following example
The source code for the previous example:
<canvas id="ShadowBlurSample2" width=750 height=75 style="border: solid 1pt blue;"> </canvas>
<script>
  var context = document.getElementById("ShadowBlurSample2").getContext('2d');
  // text settings
  context.font = '28pt Arial';
  context.fillStyle = 'red';
  // shadow settings
  context.shadowColor = 'blue';
  context.shadowBlur = 5;
  context.shadowOffsetX = 0;
  context.shadowOffsetY = 0;
  // add the text
  context.fillText ("shadow: blur 5, color blue, x- and y-offset 0", 20, 50);
</script>shadowColor
CanvasRenderingContext2D.shadowColorholds the CSS color value (see CSS colors) for the current shadow color. By default it is set to
transparent black.
Four different settings for shadowColor are shown by
and the source code for the previous canvas example is this
<canvas id="ShadowColorSample" width=650 height=70 style="border: solid 1pt blue;"> </canvas>
<script>
  var context = document.getElementById("ShadowColorSample").getContext('2d');
  // settings for the use of fillText below
  context.fillStyle = 'black';
  context.font = '40pt Arial';
  // set the shadow color to a visible 'orange' and the x- and y-offset to 15
  context.shadowBlur = 3;
  context.shadowOffsetX = 15;
  context.shadowOffsetY = 15;
  // #1
  context.shadowColor = 'aqua';
  context.fillText ("#1",  50, 50);
  // #2
  context.shadowColor = 'rgba(0%,0%,0%,0.5)';
  context.fillText ("#2", 200, 50);
  // #3
  context.shadowColor = '#CCCCCC';
  context.fillText ("#3", 350, 50);
  // #4
  context.shadowColor = 'hsl(120,50%,50%)';
  context.fillText ("#4", 500, 50);
</script>The 2D context only knows one kind of simple shapes, "simple" in the sense that it can be drawn with a single method call, namely rectangles. Of course, it is possible to draw all kinds of shapes: circles, triangles, complex polygons, smooth Bézier curves. But all these need to be composed by building more complex paths.
There are the following methods for rectangles: fillRect(), strokeRect() and clearRect(). There is also the plain rect() method, but that only serves as part of a path definition, and is therefore explained later in the section on complex shapes.
fillRect (x, y, w, h)
CanvasRenderingContext2D.fillRect (x, y, w, h)paints a solid or "filled" rectangle, using the current settings for
fillStyle. This rectangle has its left upper corner at(x,y), iswpixels wide andhpixels high.x,y,wandhare (floating point) numbers.
Here is and example of a canvas with three "filled" rectangles
The source code for the previous picture is this
// 1. draw a filled rectangle in default black
context.fillStyle = 'black';                            // this line is actually superfluous, because 'black' is default
context.fillRect(50,50,100,100);                        // draw the first rectangle

// 2. draw a filled rectangle in redd
context.fillStyle = 'red';                              // change the fillStyle to the color 'red'
context.fillRect(200,50,100,100);                       // draw the second rectangle

// 3. draw a fancy rectangle with linear gradient
var lg = context.createLinearGradient(350,50,450,150);  // create a linear gradient
lg.addColorStop(0,'yellow');                            // start (=0) the gradient with 'yellow'
lg.addColorStop(1,'red');                               // finish (=1) the gradient with 'red'
context.fillStyle = lg;                                 // set the fillStyle to this new linear gradient
context.fillRect(350,50,100,100);                       // draw the third rectangle
In each of the three cases, we first set the fillStyle and then call fillRect() to draw a rectangle accordingly. By default, the fillStyle is set to the color 'black'. In the second example, we set it to 'red' and in the third example, it is not a simple color, but a linear gradient.
strokeRect (x, y, w, h)
CanvasRenderingContext2D.strokeRect (x, y, w, h)draws a rectangle onto the canvas, which has its left upper corner at
(x,y), iswpixels wide andhpixels high. The actual style of the drawing is determined by the settings instrokeStyleand the current line and shadow properties.
Similar to the previous example canvas with filled rectangles, we now create a similar canvas by replacing all fillStyle occurrences by a strokeStyle and all the fillRect() by strokeRect() calls. Furthermore, we demonstrate the variation of the lineWidth, as this also determines the outfit of the final picture.
is generated by this code:
// 1. draw a rectangle with black strokes
context.lineWidth = 1.0;                                // this is actually superfluous, because 1.0 is default
context.strokeStyle = 'black';                          // this is superfluous, too, because 'black' is default anyway
context.strokeRect(50,50,100,100);                      // draw the first rectangle

// 2. draw a rectangle with red strokes
context.lineWidth = 7.0;                                // change the line width to 7.0
context.strokeStyle = 'red';                            // change the strokeStyle to the color 'red'
context.strokeRect(200,50,100,100);                     // draw the second rectangle

// 3. draw a rectangle with strokes in gradient style
context.lineWidth = 12.0;                               // increase the line width, once more
var lg = context.createLinearGradient(350,50,450,150);  // define a linear gradient
lg.addColorStop(0,'yellow');                            // start the gradient with the color 'yellow'
lg.addColorStop(1,'red');                               // let the gradient end with the color 'red'
context.strokeStyle = lg;                               // set the strokeStyle to this new gradient
context.strokeRect(350,50,100,100); // draw the third rectangleclearRect (x, y, w, h)
CanvasRenderingContext2D.clearRect (x, y, w, h)clears the rectangle area defined by left upper corner
(x,y), widthwand heighth.
Think of clearRect() as an eraser, deleting all previous drawings in it.
The following canvas is first filled with a green color (by means of a fillRect() call). Then a yellow rectangular box is added. And finally, a clearRect() call erases a big part of the picture again (namely everything to the right and below of (100,50)).
The source code for the previous canvas is this:
// 1. fill the whole canvas area with a transparent green color
context.fillStyle = 'rgba(0%,100%,0%,0.3)';  // green color with 0.3 transparency
context.fillRect (0,0,300,200);              // filled rectangle over the whole canvas area

// 2. draw a yellow rectangular box
context.lineWidth = 10.0;                    // set the line width to 10
context.strokeStyle = 'yellow';              // set the strokeStyle to the color 'yellow'
context.strokeRect(25,25,100,100);           // draw the yellow box

// 3. cut out a rectangle from the canvas
context.clearRect (100,50,200,150); // delete all content in this rectangle With strokeRect() and fillRect() we can draw (stroke or filled) rectangles. But in most cases, we would also like to draw other and more complex shapes. This can be done in a stepwise fashion by building paths. The standard procedure of creating any complex shape is thus
Start a new path with beginPath().
Create a sequence of primitive steps, in each one moving from the current point in the path to a new one. Possible primitive steps are: moving to a new point (with moveTo()), create a straight line to a new point (with lineTo()), a rectangular box (with rect()) or a somehow curved line (with quadraticCurveTo(), bezierCurveTo(), arc() or arcTo().
Optionally, close the path with closePath(), i.e. draw a line from the current terminal point to the initial point again. And then actually draw the path with either stroke() or fill().
Next, we demonstrate how we can reproduce the methods for drawing rectangles by building paths. We then give an overview of these building blocks for paths accompanied by a lot of examples.
Unfortunately, it is necessary to explain the path concept by a lot of examples, as it itself is not a well elaborated concept in the [W3C] standard. In the preceding [WHATWG] standard, Path objects were explicitly defined and the concept was much more comprehensive. But in [W3C] a lot of these concepts were eliminated. Paths are now handled internally behind the scences and we only have mehods to act on the CanvasRenderingContext2D object (beginPath() etc.). This reduced the size of the API, but it does not really help to grasp the path concept. Well, this is what we have to live with. And still, the original expressive power remains: it is possible to draw about anything we can possibly want to.
fillRect() by the path method
We can draw a filled rectangle with a single call of fillRect(). For example, this code
context.fillStyle = 'rgba(255,0,0,0.5)';   // fill style is now set to a half transparent red color
context.fillRect (80, 20, 100, 60);        // draw the rectangle with left upper corner (80,20), width 100 and height 60
generates this picture
Instead of calling fillRect(), we could have drawn a path along the shape of the rectangle area and then fill() it. The following code snippet thus generates exactly the same picture as the previous one:
// set the style for the fill() call below
context.fillStyle = 'rgba(255,0,0,0.5)';
// now create the path:
context.beginPath();                       // 0. start a new path
context.moveTo (80, 20);                   // 1. moves the current point to (80,20)
context.lineTo (180, 20);                  // 2. horizontal line from (80,20) to (180,20)
context.lineTo (180, 80);                  // 3. vertical line from (180,20) to (180,80)
context.lineTo (80, 80);                   // 4. horizontal line from (180,80) to (80,80)
context.lineTo (80, 20);                   // 5. vertical line from (80,80) back to the start at (80,20)
context.fill();                            // 6. draw the solid figure with the shape of the path lines
In this version we first draw the path in five steps:
Note, that with each moveTo() step (step 1., indicated by the cyan line), the current point of the path is only moved to the new indicated position. Wheareas each lineTo() step (lines in black) actually draws a line from the previous position to the new indicated point. After the path is outlined, a call of fill() creates a filled object in fillStyle inside the given lines. In our case, this results in the filled red rectangle.
strokeRect() by the path method
Of course, a red "stroke rectangle" is drawn with this path method, if we replace the fill() by the stroke() method, after we set the strokeStyle where the fillStyle was before. Alltogether, the code snippet
// set the style for the stroke() call below
context.strokeStyle = 'rgba(255,0,0,0.5)';          // now: strokeStyle instead of fillStyle
// the same path again as before:
context.beginPath();
context.moveTo (80, 20);
context.lineTo (180, 20);
context.lineTo (180, 80);
context.lineTo (80, 80);
context.lineTo (80, 20);
context.stroke();                                 // now: stroke() insted of fill()
context.closePath();
diplays this picture
which is of course the same picture as the one generated with the strokeRect() method by
context.strokeStyle = 'rgba(255,0,0,0.5)';
context.strokeRect (80, 20, 100, 60);rect()
By the way, as yet another variation of the same picture: we can also create a rectangular with a call of rect(), so that
context.strokeRect (x, y, w, h);is the same as
context.beginPath();
context.rect (x, y, w, h);
context.stroke();
And accordingly
context.fillRect (x, y, w, h);can be decomposed into
context.beginPath();
context.rect (x, y, w, h);
context.fill();beginPath()
CanvasRenderingContext2D.beginPath()begins a new or resets the current path.
A new path is then built withmoveTo(),lineTo(),rect(),quadraticCurveTo(),bezierCurveTo(),arc()andarcTo().
The actual drawing of the path is done withstroke()orfill().
A call ofclosePath()does close the new path, but in the sense that the current point is connected to the intial starting point. It does not cause the path to be drawn.
For common applications of beginPath() see the examples below, in the sections explaining stroke() and fill().
closePath()
CanvasRenderingContext2D.closePath()in an open path, this method call "closes" the path in the sense that it connects the current point to the starting point of the path. Note, that
closePath()does not "finish" the path in the sense that it draws it. To do that, you still need to call thestroke()orfill()method.
For example, this code snippet (where lineWidth is set to 5.0 and strokeStyle to 'red')
context.beginPath();
context.moveTo(150,25);      // starting point at the top of the triangle
context.lineTo(250,100);     // line to right bottom corner
context.lineTo(50,100);      // line to left bottom corner
context.stroke();            // draw the lines
generates this "incomplete triangle" picture
But if we now insert a closePath() preceding the stroke() call
context.beginPath();
context.moveTo(150,25);      // starting point at the top of the triangle
context.lineTo(250,100);     // line to right bottom corner
context.lineTo(50,100);      // line to left bottom corner
context.closePath();         // closes the shape with a line from the left bottom to the initial top point
context.stroke();            // draw the lines
the shape is "closed", the triangle is complete:23
closePath() does not draw
Each beginPath() needs either a fill() or stroke() at some point later on to actually create a figure on the canvas. Just putting a closePath() does close that path, indeed, but does not draw it. Leaving out the stroke() call in the previous example would have resulted in an empty canvas (picture).
closePath() call preceding a fill() call is superfluous
The stroke() command of the previous example draws the shape of the path, with fill() we draw the full shape. More precisely, when we replace stroke() by fill() and run this code (now with fillStyle set to 'red')
context.beginPath();
context.moveTo(150,25);
context.lineTo(250,100);
context.lineTo(50,100);
context.closePath();           // (superfluous, actually)
context.fill();                // draw the full triangle shape
we obtain this picture
But as a path needs to be closed anyway before we can "fill" the shape, the fill() command closes the path by default. This makes the closePath() call superfluous. Leaving out this line of code would have created exactly the same picture.
stroke()
CanvasRenderingContext2D.stroke()draws the outline of the shape defined by the current path. The style settings for the actual drawing are the ones that are stored in
strokeStyle, the current properties for lines and shadows.
Usually, a path is created with an initial beginPath(), followed by a number of moveTo(), lineTo(), rect(), quadraticCurveTo(), bezierCurveTo(), arc() and arcTo() calls. A final stroke() call then draws the shape.
The following canvas comprises two paths for two shapes
The source code is this
// settings for both shapes
context.lineWidth = 10.0;           // set the line width for both stroke figures to 10
// the first shape
context.beginPath();                // start a new path
context.strokeStyle = 'lime';       // set the color for subsequently called stroke() calls to 'lime'
context.moveTo (25, 25);            // go to point (25,25) and make that the current point in the path
context.lineTo (25, 125);           // add a line from (25,25) to (25,125) to the path
context.lineTo (125, 125);          // add another line from (25,125) to 125,125) to the path
context.stroke();                   // now the path is drawn, according to the lineWith and strokeStyle properties
// the second shape
context.beginPath();                // start another path
context.strokeStyle = 'maroon';     // now set the color for coming stroke drawings to 'maroon'
context.moveTo (175, 25);           // go to (175,25)
context.lineTo (175, 125);          // add a line from (175,25) to (175,125) to the path
context.lineTo (275, 125);          // add a line from (175,125) to (275,125) to the path
context.stroke(); // eventually draw the path in stroke styleIf we add a line
context.closePath();before each of the two occurrences of the
context.stroke();lines in the previous code, the paths are closed and become a triangle, each. The picture is then this
fill()
CanvasRenderingContext2D.fill()draws the full area of the shape defined by the current path. The style settings for the actual drawing are the ones that are stored in
fillStyleand the current properties for shadows.
Usually, a path is created with an initial beginPath(), followed by a number of moveTo(), lineTo(), rect(), quadraticCurveTo(), bezierCurveTo(), arc() and arcTo() calls. A final fill() call then draws the shape, filled with the color (gradient or pattern) defined by fillStyle.
The following canvas comprises two "filled" triangles
The source code for this picture is this
// the first triangle
context.fillStyle = 'lime';    // set the color for shapes subsequently drawn with fill() to 'lime'
context.beginPath();           // start a new path
context.moveTo (25, 25);       // go to (25,25), which now becomes the current point in the path
context.lineTo (25, 125);      // add a line from (25,25) to (25,125); the latter is the new current point in the path
context.lineTo (125, 125);     // add another line from (25,125) to (125,125) to the path
context.fill();                // the path is closed with a line from (125,125) to the initial (25,25) and
                               // the shape area is now drawn with the fillStyle color 'lime'
// the second triangle
context.beginPath();           // start another path
context.moveTo (175, 25);      // go to (175,25)
context.lineTo (175, 125);     // add a line from (175,25) to (175,125)
context.lineTo (275, 125);     // add a line from (175,125) to (275,125)
context.fillStyle = 'maroon';  // set the fillStyle to the color 'maroon'
context.fill(); // close the path, making it a triangle, and draw the shape area in 'maroon' colorSuppose we create a path with a couple of lines, like so
context.beginPath();
context.moveTo (50,25);
context.lineTo (50,125);
context.lineTo (150,25);
context.lineTo (150,125);
context.lineTo (250,25);
context.lineTo (250,125);
We can visualize this path (by calling stroke(), of course) and it looks like this 24
But note, that if we add these lines to the code
context.fillStyle = 'red';
context.fill();
we do not get this picture (of a convex polygon)
but this (concave) one instead
Remember, that calling fill() means, that the path is closed first, i.e. the end point (250,125) is connected to the initial point (50,25) like so:
(Of course, that canvas was created by calling closePath() and stroke().)
And with this view of the closed path it becomes apparent what the fill() call does: it fills all the closed regions of the created shape.
lineTo (x, y)
CanvasRenderingContext2D.lineTo (x, y)adds a line to the path from the current point to the new point
(x,y).
A typical example for the use of lineTo() is the constrution of a polygon. Let us draw a triangle, the simplest of all polygons. This code
context.strokeStyle = 'navy'; // set the strokeStyle color to 'navy' (for the stroke() call below)
context.lineWidth = 3.0;      // set the line width to 3 pixels
context.beginPath();          // start a new path
context.moveTo (150,30);      // set (150,20) to be the starting point
context.lineTo (270,120);     // line from (150,30) to (270,120)
context.lineTo (30,120);      // horizontal line from (270,120) to (30,120)
context.lineTo (150,30);      // line back to the starting point (we could have called closePath() instead)
context.stroke();             // actually draw the triangle shape in 'navy' color and 3 pixel wide lines
generates this picture
Note, that the last call of lineTo() in the source code draws a line from the left corner to the initial top point of the triangle, again. We could have replaced this line of code by a call of context.closePath(), because closePath() does that return to the initial point for us.25
lineTo() does not draw lines, the drawing is done with the stroke() call. We could also have called the fill() method to generate this picture
Actually the source code is this:
context.fillStyle = 'navy';   // set the fillStyle color to 'navy' (for the fill() call below)
context.beginPath();          // start a new path
context.moveTo (150,30);      // set (150,20) to be the starting point
context.lineTo (270,120);     // line from (150,30) to (270,120)
context.lineTo (30,120);      // horizontal line from (270,120) to (30,120)
context.fill();               // actually draw the triangle shape in 'navy' color and 3 pixel wide lines
Note, that we neither used a lineTo() call for a line from the left corner (30,120) to the inial top corner (150,30), nor did we call closePath() at the end of the path. This would have been superfluous, because fill() does close the path automatically.
moveTo (x, y)
CanvasRenderingContext2D.moveTo (x, y)moves the path to the new point
(x,y). Different tolineTo(x,y), themoveTo(x,y)call does not create a line to the new point.
This code snippet
// set the line style to be drawn with stroke()
context.lineWidth = 9.0;
context.strokeStyle = 'red';
// create the path
context.beginPath();
context.moveTo (50,25);   context.lineTo (50,75);    // first vertical line
context.moveTo (100,25);  context.lineTo (100,75);   // second vertical line
context.moveTo (150,25);  context.lineTo (150,75);   // third vertical line
context.stroke();
generates this picture
But if we would have replaced each of the three moveTo() calls by lineTo() calls in the code, the picture would be this:
rect (x, y, w, h)
CanvasRenderingContext2D.rect (x, y, w, h)creates a rectangle with left upper corner at
(x,y), which iswpixels wide andhpixels high.
Note, that the rectangle is not drawn with this command. Therefore a subsequent stroke() or fill() call is required.
Note also, that the two steps of first creating and then drawing the rectangle are combined in the two methods strokeRect() and fillRect().
Suppose we want to draw a little house
We could construct a path of six separate lines. But we can also built it by creating one square (with rect()) and a roof (two lineTo() calls) like so
context.beginPath();                // start a new path
context.rect (20,60,60,60);         // create the square body of the house
context.moveTo (10,70);             // create the roof by 1. move to the left
context.lineTo (50,10);             //                    2. create the left line
context.lineTo (90,70);             //                    3. create the right line
context.strokeStyle = "black";      // draw the house by 1. set the strokeStyle to 'black'
context.lineWidth = 5.0;            //                   2. increase the default lineWidth to 5.0
context.stroke(); // 3. do the actual drawingfill() instead of stroke()
Of course, if we would have replaced the last three lines of the previous code by these new lines
var lg = context.createLinearGradient (20,20,100,130);  // create a linear gradient named lg
lg.addColorStop (0, 'yellow');                          // set the color of lg at the beginning (=top) to 'yellow'
lg.addColorStop (1, 'red');                             // set the color of lg at the end (right bottom) to 'red'
context.fillStyle = lg;                                 // set the fillStyle to lg
context.fill();                                         // draw the house with the fillStyle settings
we would have obtained this picture
The actual drawing is done with fill() instead of stroke(), and accordingly, this is not done in strokeStyle but fillStyle. And this time, fillStyle is not just an ordinary color, but a linear gradient (see createLinearGradient() and addColorStop()).
rect()
It is possible to replace the rect() methods by creating the rectangular with a couple of lines. More precisely, this one line
context.rect (x, y, w, h);can be seen as just an abbreviation for these six lines
context.beginPath();         // start a new path
context.moveTo (x,y);        // move to the top left corner as starting point
context.lineTo (x+w, y);     // horizontal line to the top right corner
context.lineTo (x+w, y+h);   // vertical line to the right bottom corner
context.lineTo (x, y+h);     // horizontal line to the left bottom corner
context.closePath(); // vertical line back to the top left corner quadraticCurveTo (cpx, cpy, x, y)
CanvasRenderingContext2D.quadraticCurveTo (cpx, cpy, x, y)creates a curved line from the current point 0 to the new point 1 at
(x,y), determined by a control point cp at(cpx,cpy). The curve initially points into the direction of cp at 0, and finally moves into point 1 coming from cp.
The full proper title of what the method here calls "quadratic curve" is "quadratic Beziér curve". And the "Beziér curve" from the next method (see bezierCurveTo() below) is a "cubic Beziér curve" in proper termininology. The Wikipedia article on Bézier curves has very nice and intuitive animations on constructing Bézier curves.
This code snippet
context.lineWidth = 5.0;
context.strokeStyle = 'red';
context.beginPath();
context.moveTo (30,120);
context.quadraticCurveTo (210, 30, 210, 120);
context.stroke();
generates this picture
With moveTo(30,120) the current point 0 is located at (30,120). By calling quadraticCurveTo(210,30,210,120), the control point cp is (210,30) and the new point 1 is (210,120).
The red curve starts in 0 and moves towards cp (geometrically speaking: the line from 0 to cp is a tangent to the curve at point 0), and then bends towards 1 (again: the line from cp to 1 is a tangent to the curve at point 1).
Suppose, we attempt to draw an ellipse, which should eventually look like this26
Obviously, the two horizontal and two vertical lines on the next picture are tangents of the ellipse
and we can compose the ellipse essentially as a sequence of four quadraticCurveTo() calls.
We start at the top point 0 and call quadraticCurveTo() for the first time via control point cp1 to point 1:
The according code is this
context.moveTo (150,25);                     // move to point 0 at (150,25)
context.quadraticCurveTo (275,25,275,75);    // curve from point 0 to point 1 at (275,75)
We repeat that step three more times,
i.e. we add three more quadraticCurveTo() calls and wrap the pieces between a beginPath() and stroke() call, so that the full code for the original shape is this
context.lineWidth = 5.0;                        // set the line width for the stroke() call below
context.strokeStyle = 'red';                    // set the color to 'red' for the stroke() call below
context.beginPath();                            // start the new path
context.moveTo (150,25);                        // move to point 0 at (150,25)
context.quadraticCurveTo (275,25,275,75);       // curve from point 0 to point 1 at (275,75)
context.quadraticCurveTo (275,125,150,125);     // curve from point 1 to point 2 at (150,125)
context.quadraticCurveTo (25,125,25,75);        // curve from point 2 to point 3 at (25,75)
context.quadraticCurveTo (25,25,150,25);        // curve from point 3 back to point 0
context.stroke(); // draw the shape defined by the current pathquadraticCurveTo() as a special case of bezierCurveTo()
In theory, the quadraticCurveTo() method is just a special case of bezierCurveTo(), which has two instead of one control points. One just has to repeat the same control point again, i.e. we could just replace each
quadraticCurveTo (cpx, cpy, x, y)call by
bezierCurveTo (cpx, cpy, cpx, cpy, x, y)This possibility might also be interesting because there seems to be a bug in the Firefox 1.5 implementation of the quadraticCurveTo() method. This is mentioned in the Mozilla Development Network canvas tutorial, which also provides a bug workaround.
But in fact, the browser vendors don't seem to implement it that way, as you might discover in you own browser when comparing the following two pictures. Let us consider the ellipse example again, first implemented with quadraticCurveTo() calls as before. This snippet
context.beginPath();
context.moveTo (150,25);
context.quadraticCurveTo (275,  25, 275,  75);
context.quadraticCurveTo (275, 125, 150, 125);
context.quadraticCurveTo ( 25, 125,  25,  75);
context.quadraticCurveTo ( 25,  25, 150,  25);
context.stroke();
produces this view in your browser
Compare that to the implementation with bezierCurveTo() calls
context.beginPath();
context.moveTo (150,25);
context.bezierCurveTo (275,  25, 275,  25, 275,  75);
context.bezierCurveTo (275, 125, 275, 125, 150, 125);
context.bezierCurveTo ( 25, 125,  25, 125,  25,  75);
context.bezierCurveTo ( 25,  25,  25,  25, 150,  25);
context.stroke();
producing this picture
bezierCurveTo (cp1x, cp1y, cp2x, cp2y, x, y)
CanvasRenderingContext2D.bezierCurveTo (cp1x, cp1y, cp2x, cp2y, x, y)creates a curved line from the current point 0 in the path to the new point 1 at
(x,y). The two control points cp1 at(cp1x,cp1y)and cp2 at(cp2x,cp2y)determine the actual shape of the line: Leaving from 0 the curve first heads into the direction of cp1, and finally entering into 1, the curve comes out of the direction of cp2.
Let us consider the following snippet
context.beginPath();
context.moveTo (30,120);                              // go to point 0 at (30,120)
context.bezierCurveTo (120, 30, 240, 30, 240, 120);   // curve from point 0 to point 1 at (240,120)
context.stroke();
which creates the following red curve
The curve starts in point 0 towards cp1 and terminates in point 1 coming from cp2.
The same principle holds when we change the position of the involved points. For example
Also note, that even "pulling" cp1 away from point 0 (or cp2 away from 1) also pulls at the curve and bends it stronger:
As mentioned before, the proper title of what this method here calls "Beziér curve" is "cubic Beziér curve". And the "quadratic curve" from the previous method (see quadraticCurveTo() above) is actually a "quadratic Beziér curve" in proper maths terms. Your should really check out the intuitive animations in the according Wikipedia entry, in particular the section on constructing Bézier curves.
The whole theory on Beziér curves was developed in car factories for the practical purpose of creating smooth auto bodies. But finding the code for a given shape by hand can be a daunting task. Let us exercise a straight forward method on how this can be done. Suppose we try to find the code for say the shape of a heart: 27
We start by identifying a couple of significant points 0, 1, 2, 3, 4, 5, and the tangents (displayed in green), i.e. the lines that touch the red shape at that particular point:
Then we read off the bezierCurveTo() calls from each piece in the path. Sometimes, we need to play a little with the best location of the control points on the tangent, i.e. we can do some pulling as described earlier, to get the red line into the best shape. We obtain the following six results:
We finally just gather the pieces and end up with the code for the original canvas picture
context.fillStyle = 'red';
context.beginPath();
context.moveTo (150,60);                        // start at point 0
context.bezierCurveTo (150,30, 100,30, 90,30);  // from point 0 to point 1
context.bezierCurveTo (60,30,30,60,30,90);      // from point 1 to point 2
context.bezierCurveTo (30,180,90,210,150,240);  // from point 2 to point 3
context.bezierCurveTo (210,210,270,180,270,90); // from point 3 to point 4
context.bezierCurveTo (270,60,240,30,210,30);   // from point 4 to point 5
context.bezierCurveTo (180,30,150,30,150,60);   // from point 5 to point 0
context.fill(); arc (x, y, r, start, end, anticlockwise)
CanvasRenderingContext2D.arc (x, y, r, start, end, anticlockwise)defines a piece of a circle. The center of this circle is
(x,y), the radius isr. Thestartandendpoint of the arc are given as angles in radians. The optional booleananticlockwiseparameter defines if the arcs are measured counterclockwise (valuetrue) or clockwise (valuefalse, wich is the default). A call ofarc()is part of a path declaration, the actual drawing is done with a call ofstroke(), drawing a piece of the circle line, orfill(), which draws a section of the circle disk.
For example, let us draw sections of five circle disks, each one with a radius of 50 pixels
which is generated by the code snippet
context.fillStyle = "rgba(255,0,0,0.33)";    // red color with 1/3 transparency
// now draw five filled circle pieces:
context.beginPath(); context.arc ( 60, 60, 50, 0, 2 * Math.PI, false); context.fill();    // 1st
context.beginPath(); context.arc (180, 60, 50, 0,     Math.PI, false); context.fill();    // 2nd
context.beginPath(); context.arc (300, 60, 50, 0,     Math.PI, true ); context.fill();    // 3rd
context.beginPath(); context.arc (420, 60, 50, 2,           6, false); context.fill();    // 4th
context.beginPath(); context.arc (540, 60, 50, 2,           6, true ); context.fill();    // 5th
And if we replace fillStyle by strokeStyle and each occurrence of fill() by stroke(), we obtain this picture of five circle arcs:
Let us add the coordinate system and a red dot for the center of each arc so that we can see their precise posititons:
Each call of
arc (x, y, r, start, end, anticlockwise)defines a circle with center (x,y) and radius r.
Every angle a is measured from 3 o'clock position of the given circle in the clockwise direction:
Note, that the unit of each angle a is given in radian rad, i.e. the angle is a rad and the length of the arc is a * r.
The 4th arc of the initial example, drawn by arc(420,60,50,2,6,false) had a start angle of 2 rad and an end angle of 6 rad
And if we change the fifth parameter false to true, i.e. if we call arc(420,60,50,2,6,true), so that the direction on the circle is not clockwise, but anticlockwise, we obtain the 5th arc
Most users are more familiar with degree ° instead of radian rad as a unit for angles. Recall, that a full circle is 2π (about 6.283), and that π is in JavaScript given by the constant value
Math.PI = 3.141592653589793We convert back and forth between radian and degree using the equation 360°=2π
In the initial example, the 1st arc was a full circle, and we draw that with start angle 0 and end angle 2*Math.PI. The 2nd and 3rd were half circles from start angle 0 to end angle Math.PI, drawn clockwise and anticlockwise, respectively.
Recall from trigonometry, that a point on a circle with center (x,y), radius r and at an angle of a, has the coordinates
(r cos(a) + x, r sin(a) + y)In JavaScript, this is given by
(r * Math.cos(a) + x, r * Math.sin(a) + y)For example, the black point in this picture
with a = 135° = 3/4π has the coordinates
(60*Math.cos(3/4*Math.PI)+80, 60*Math.cos(3/4*Math.PI)+80) === (37.573593128807154, 122.42640687119285)arc() as a piece in the current path
A call of arc() is part of the current path. It depends on the current point before it was called, and the end point of the arc becomes the new current point afterwards. For example, this code
context.lineWidth = 3.0;
context.strokeStyle = "red";
context.beginPath ();
context.moveTo (30, 90);
context.arc (210, 90, 60, 2, 6);
context.lineTo (390, 90);
context.stroke();
generates this picture
The initial point of the path is (30,90). The call of arc() defines that arc, but also the line from the initial (30,90) to the starting point of the arc. After the call, the new current point is the end point of the arc. And the final call of lineTo() draws the line from the arc to (390,90)
If you want to prevent this behavior and the extra lines, wrap the arc() call between a beginPath() and stroke() or fill(), as we did in all our examples so far. That ensures that only the arc itself is drawn.
Let us consider our initial example canvas example again with five arcs
Recall, that we wrapped each arc() call inside a sequence beginPath(); arc(); stroke();. If we would have wrapped all five arc() calles in just one path, i.e. if this would have been our code
context.beginPath();
context.arc ( 60, 60, 50, 0, 2 * Math.PI, false);   // 1st
context.arc (180, 60, 50, 0,     Math.PI, false);   // 2nd
context.arc (300, 60, 50, 0,     Math.PI, true );   // 3rd
context.arc (420, 60, 50, 2,           5, false);   // 4th
context.arc (540, 60, 50, 2,           5, true );   // 5th
context.stroke();
the picture would look like this
The start and end point of the arc become part of the path definition. The same holds in general for filled objects and with drawing methods inside the path.
As a last example, let us take this canvas with a single arc
generated by this code
context.beginPath();
context.arc (120, 60, 50, 2, 5, true);
context.fill();
If we add a point, say (30,25) before the arc, and if we draw a line afterwards, say to (30,100), i.e. if we use this code
context.beginPath();
context.moveTo (30,25);
context.arc (120, 60, 50, 2, 5, true);
context.lineTo (30,100);
context.fill();
the canvas looks like this
The path itself, which is visible if we replace the fill by stroke in the code, is this
arcTo (x1, y1, x2, y2, radius)
CanvasRenderingContext2D.arcTo (x1, y1, x2, y2, radius)draws an arc with the given
radius, depending on the current point in the path and the two specified points(x1, y1)and(x2, y2). For more details of this method, see the following examples and description.
Let context be the 2D context of a default size canvas (the lineWidth is set to 5.0, the strokeStyle is 'red'). Then the following code snippet
context.beginPath();
context.moveTo (60, 120);
context.arcTo (150, 30, 240, 120, 50);
context.stroke();
generates this picture
The shape drawn by the arcTo (x1, y1, x2, y3, radius) depends on three points:
the current point (x0,y0) in the path, in the example this is (60,120), the state after the moveTo(60,120) call.
point (x1,y1), here: (150,30), and
(x2,y2), which is (240,120) in our example.
The position of these three points on the canvas is this:
Now imagine two half-infinite lines with point 1 as their origin, one going through point 0, the other one via point 1.
Now, the actual arcTo (x1, y1, x2, y3, radius) draws a line that has its origin in point 0, runs towards point 1, makes a turn towards point 2, so that radius is the actual radius of the arc. The ending point of the arcTo() line is the point, where the arc meets the tangent line (from point 1 towards point 2).
The whole idea probably becomes more obvious, if we use the same code snippet
context.beginPath();
context.moveTo (60, 120);
context.arcTo (150, 30, 240, 120, radius);  // different values for radius
context.stroke();
and just vary the radius. The resulting pictures are these:
clip()
CanvasRenderingContext2D.clip()clips a region of any shape and size from the canvas.
Suppose we have any drawing on a canvas, say a rectangle with text
and suppose, we want to clip from this canvas the part that is defined by this circle
so that the overall result looks like this
The standard method to achieve this is in three steps: 1. draw the shape of the area to be clipped, 2. call the clip() method and 3. draw the canvas content
The source code of the previous example is
// 1. clipped circle area
context.fillStyle = 'yellow';
context.beginPath();
context.arc (60, 60, 60, 0, 2*Math.PI);
context.fill();
// 2. clip
context.clip();
// 3. draw a rectangle with text
context.fillStyle = 'aqua';
context.fillRect (30, 60, 180, 60);
context.fillStyle = 'red';
context.font = '60px sans-serif';
context.fillText ('Hello!', 30, 110);In the previous example, both the clipped circle area and the canvas drawings where filled shapes. But we can replace either of these filled by stroke figures. For example, if we replace each occurrence of a "fill" by a "stroke" in the previous code, the picture will be this
The clip technique works for all canvas drawings, including images. To cut out a disk from an horse image, we can use this code 28
// clipped circle area
context.beginPath();
context.arc (60, 60, 60, 0, 2*Math.PI);
context.fill();
// clip
context.clip();
// insert the image
var image = new Image();
image.src = "horse.jpg";
context.drawImage (image, 0, 0, 120, 120); // insert the image at (0,0) on an area of 120x120 pixels
The result is this
isPointInPath (x, y)
CanvasRenderingContext2D.isPointInPath (x, y)returns
trueif the specified point(x,y)is in the current path, andfalseotherwise.
For example, this code snippet
// add a new path
context.beginPath();
context.moveTo (75,130);                // make (75,130) the current point
context.lineTo (145,75);                // line from (75,130) to (145,75)
context.arc (75,75,70,0,Math.PI,true);  // draw half circle disk with center (75,75), radius 70 and counterclockwise
context.lineTo (75,130);                // line from (5,70) to (75,130)
context.lineWidth = 3.0;                // set the line width for the stroke drawing
context.strokeStyle = 'purple';         // set the line color for the stroke drawing
context.stroke();                       // draw the shape

// determine the position of two points
var answer1 = context.isPointInPath (25,100);    // answer1 is now either true or false
var answer2 = context.isPointInPath (100,25);    // answer2 is also either true or false

// print out the result on the canvas
context.font = "14pt sans-serif";                                        // set the font for the text
context.fillText ( "isPointInPath(25,100)  is  " + answer1, 200, 50);    // print the first line of text
context.fillText ( "isPointInPath(100,25)  is  " + answer2, 200, 100);   // print the second line of text
generates this canvas picture
Text is added to the canvas (context) with either of the two methods:
fillText (text, x, y)orfillText (text, x, y, maxWidth)
writes the giventextstring at point(x,y)in "filled letters" (according to the currentfillStylesettings)
strokeText (text, x, y)orstrokeText (text, x, y, maxWidth)
writes the giventextstring at point(x,y)in "stroke letters" (according to the currentstrokeStylesettings)The actual rendering of the text is also dependent on the current values of the following properties:
textAlignfor the horizontal andtextBaselinefor the vertical text alignmentthe current shadow settings (
shadowOffsetX,shadowOffsetY,shadowBlur,shadowColor)
font
CanvasRenderingContext2D.fontsets the font (i.e. the style, size, etc.) with which text is added to the canvas (context). Its value any value of the CSS3
fontproperty (see CSS fonts below). The defaultfontvalue is'10px sans-serif'. Values that cannot be parsed as CSS font values are ignored. Relative keywords and lengths are computed relative to the font of the canvas element.
On the following canvas, in each line the font is set to another value, and this value is displayed with strokeText() on the left and fillText() on the right:
The source code for the previous canvas picture is this:
// set both the strokeStyle and the fillStyle to black
context.strokeStyle = 'black';
context.fillStyle = 'black';
// first line of text in the default font:
context.strokeText(context.font, 10, 20);
context.fillText (context.font, 350, 20);
// second line of text:
context.font = '20px fantasy';
context.strokeText(context.font, 10, 40);
context.fillText (context.font, 350, 40);
// third line of text:
context.font = '40px Verdana';
context.strokeText(context.font, 10, 80);
context.fillText (context.font, 350, 80);
// fourth line of text:
context.font = '60px Arial';
context.strokeText(context.font, 10, 140);
context.fillText (context.font, 350, 140); textAlign
CanvasRenderingContext2D.textAlignsets the horizontal alignment of text (similar to the CSS
text-alignproperty). Its values is one of the following:'start','end','left','right'or'center'. The default value is'start'.
In each of the following examples, context is the 2d context of the given canvas element.
Calling
context.textAlign = 'left';
context.fillText ("Hello world!", 300, 30);</pre>
looks like this:
Calling
 context.textAlign = 'right';
 context.fillText ("Hello world!", 300, 30);
looks like this:
Calling
 context.textAlign = 'center';
 context.fillText ("Hello world!", 300, 30);
looks like this:
The actual appearance of the text when textAlign is set to 'left' or 'right' depends on the directionality of text. This directionality is defined in the dir attribute, it is either 'ltr' (left-to-right) or 'rtl' (right-to-left), and the canvas element inherits this value.
If the directionality is 'ltr' and textAlign is set to 'start', or
if the directionality is 'rtl' and textAlign is set to 'end', then
the text appears as in textAlign=left.
If the directionality is 'ltr' and textAlign is set to 'end', or
if the directionality is 'rtl' and textAlign is set to 'start', then
the text appears as in textAlign=right.
textBaseline
CanvasRenderingContext2D.textBaselinesets the vertical alignment of text and has one of the following values:
'top','hanging','middle','alphabetic','ideographic'or'bottom'. The default value is'alphabetic'.
The following image (taken from the W3.org text on the canvas element) explains the different lines that are involved in writing:
This script
<canvas id="TextBaselineSample" width=750 height=100></canvas>
<script>
  var context = document.getElementById('TextBaselineSample').getContext('2d');
  context.addGrid (50);
  context.font = '20px monospace';
  context.textBaseline = 'top';          context.fillText ( "top",         0,   50);
  context.textBaseline = 'hanging';      context.fillText ( "hanging",     100, 50);
  context.textBaseline = 'middle';       context.fillText ( "middle",      200, 50);
  context.textBaseline = 'alphabetic';   context.fillText ( "alphabetic",  300, 50);
  context.textBaseline = 'ideographic';  context.fillText ( "ideographic", 450, 50);
  context.textBaseline = 'bottom';       context.fillText ( "bottom",      600, 50);
</script>
looks like that
fillText (text, x, y) and fillText (text, x, y, maxWidth)
CanvasRenderingContext2D.fillText (text, x, y)and
CanvasRenderingContext2D.fillText (text, x, y, maxWidth)draw the given
textstring at the(x,y)position in filled characters on the canvas. If the optional (floating point number)maxWidthis set, the text is compressed to fit into this boundary.
By default,xis thestartpoint of thetextstring (see textAlign) andyis thealphabeticbaseline (see textBaseline).
For example, the following code snippet
context.fillStyle = 'black';         // explicitly sets the text color to (default) 'black'
context.font = '50px monospace';
context.fillText ("Hello world!", 0, 50);
context.fillText ("This is a longer string that is limited to 750 pixel.", 0, 100, 750);
context.fillText ("This is a longer string that is limited to 300 pixel.", 0, 150, 300);
renders as follows
strokeText (text, x, y) and strokeText (text, x, y, maxWidth)
CanvasRenderingContext2D.strokeText (text, x, y, maxWidth)and
CanvasRenderingContext2D.strokeText (text, x, y, maxWidth)draw the given
textstring at the(x,y)position in stroke characters on the canvas. If the optional (floating point number)maxWidthis set, the text is scaled accordingly.
By default,xis thestartpoint of thetextstring (see textAlign) andyis thealphabeticbaseline (see textBaseline).
(According to the reference on w3schools.com, the maxWidth property is not supported by the Safari browser.)
For example, this code
context.strokeStyle = 'black';        // explicitly sets the text color to (default) 'black'
context.lineWidth = 2.0;              // double of the default lineWidth
context.font = '50px monospace';
context.strokeText ("Hello world!", 0, 50);
context.strokeText ("This is a longer string that is limited to 750 pixel.", 0, 100, 750);
looks as follows
measureText(text).width
CanvasRenderingContext2D.measureText(text).widthreturns the width of the
textstring in the current font settings and measured in pixels.
So, if context is the 2d context of the given canvas, then context.measure('Hello world!').width returns the length of the string "Hello world!" in the current settings.
The form of this call is rather awkward, and of course it is a combination of two steps: canvas.measureText(text) returns a TextMetrics object. In the [WHATWG] specification, a TextMetrics object held quite a lot of information. But all this is obscured away in the official [W3C] standard, only the width property of the TextMetrics object remains accessible. By calling canvas.measureText(text).width we obtain that information.
Recall, that the current height of text is set and stored by the font property.
In the following example, w takes the value for the width of the string "This is some text." in the current font settings (namely 30px Arial). As it turns out, w is 233.
The source code of the previous example is this:
<canvas id="TextSampleMeasureText" width=700 height=70></canvas>
<script>
  var canvas = document.getElementById('TextSampleMeasureText');
  var context = canvas.getContext('2d');
  context.addGrid (30);
  var text = "This is some text.";
  context.font = '30px Arial';
  context.fillText (text, 0, 30);
  var w = context.measureText(text).width;
  context.fillText ("The previous line is " + w + " pixel wide.", 0, 60);
</script>We can insert an image into the canvas with
context.drawImage (image, ...)where
contextis theCanvasRenderingContext2Dobject of the given canvas, andimageis either
a
HTMLImageElement(such as a JPEG or PNG file image) oranother
HTMLCanvasElement, or evena
HTMLVideoElement.The
drawImage(image,...)method comes in several versions of increasing flexibility and number of parameters...and these are described next.29
drawImage (image, dx, dy)
CanvasRenderingContext2D.drawImage (image, dx, dy)draws the
imageonto the canvas, where(dx,dy)is the point of its left upper corner.
For example, given the file horse.jpg, which is a 300x425 pixel image and let context be the 2d context of a given 400x500 pixel canvas. Then this code
var image = new Image();               // 1. create the image: (a). create an image object
image.src = "horse.jpg";               //                      (b). set it to the jpg file
context.drawImage (image, 50, 50);     // 2. draw the image onto the canvas at (50,50)
generates this picture
drawImage (image, dx, dy, dw, dy)
CanvasRenderingContext2D.drawImage (image, dx, dy, dw, dh)draws an
imageas the rectangle(dx,dy,dw,dy)into the canvas, where(dx,dy)is the upper left corner of this destination rectangle,dwis its width anddhits height.
For example, if we take our horse.jpg image again, and context is the 2d context of a 700x500 pixel canvas, then the code
  var image = new Image();
  image.src = "horse.jpg";
  context.drawImage (image, 50, 50, 600, 150);
  context.drawImage (image, 50, 250, 150, 200);
  context.drawImage (image, 350, 250, 100, 200);
  context.drawImage (image, 600, 250, 50, 200);
renders as
drawImage (image, sx, sy, sw, sh, dx, dy, dw, dh)
CanvasRenderingContext2D.drawImage (image, sx, sy, sw, sh, dx, dy, dw, dh)cuts a rectangle
(sx,sy,sw,sh)out of the sourceimageand inserts it as(dx,dy,dw,dh)into the destination canvas.
For example, if we use our horse image horse.jpg again, context is the 2d context of a 350x350 canvas, then
var image = new Image();
image.src = "horse.jpg";
context.drawImage (image, 150, 40, 130, 120, 75, 100, 200, 150);
generates this picture
The rectangle (sx,sy,sw,sh) from the source image has the left upper corner at (sx,sy), width sw and height sh.
|
The rectangle (dx,dy,dw,dh) in the destination canvas has the left upper corner at (dx,dy), width dw and height dh.
|
The picture of a canvas can be formalized as a structure that contains the color value for each of its pixels. This is done by an ImageData object. We will now show how to create such an object with createImageData(), how we to cut out such an object from a canvas with getImageData() and how to insert such an object into an area of a given canvas with putImageData().
ImageDataAn
ImageDataobject is a formal representation of an image and given by three properties: The two integer valueswidthandheightfor its size anddata, an array (CanvasPixelArray) that holds the color values for all pixels.
Suppose we have an image (a canvas, or section from a canvas context) with a given width w and height h. The color of each pixel (x,y) is given by the RGBA color rgba(R(x,y),G(x,y),B(x,y),A(x,y)), where each of the four components R(x,y), G(x,y), B(x,y), A(x,y) is a value from the set {0,1,2,...,255} and R stands for the amount of red, G for green, B for blue, and A for the "alpha" or transparency value. The whole image is then formally represented by a table like this one:
x = 0
|
x = 1
|
... |
x = w-1
|
|
|---|---|---|---|---|
y = 0
|
rgba(R(0,0),G(0,0),B(0,0),A(0,0))
|
rgba(R(1,0),G(1,0),B(1,0),A(1,0))
|
... |
rgba(R(w-1,0),G(w-1,0),B(w-1,0),A(w-1,0))
|
y = 1
|
rgba(R(0,1),G(0,1),B(0,1),A(0,1))
|
rgba(R(1,1),G(1,1),B(1,1),A(1,1))
|
... |
rgba(R(w-1,1),G(w-1,1),B(w-1,1),A(w-1,1))
|
y = 2
|
rgba(R(0,2),G(0,2),B(0,2),A(0,2))
|
rgba(R(1,2),G(1,2),B(1,2),A(1,2))
|
... |
rgba(R(w-1,2),G(w-1,2),B(w-1,2),A(w-1,2))
|
...
|
... | ... | ... | |
y = h-1
|
rgba(R(0,h-1),G(0,h-1),B(0,h-1),A(0,h-1))
|
rgba(R(1,h-1),G(1,h-1),B(1,h-1),A(1,h-1))
|
... |
rgba(R(w-1,h-1),G(w-1,h-1),B(w-1,h-1),A(w-1,h-1))
|
In an ImageData object this information is stored in this three-property object:
{
  width  : w,
  height : h,
  data   : [ R(0,0),G(0,0),B(0,0),A(0,0) , R(1,0),G(1,0),B(1,0),A(1,0) ,  ... , R(w-1,h-1),G(w-1,h-1),B(w-1,h-1),A(w-1,h-1) ]
}
The data value is an array comprising all the color values in one single sequence. The length of this array is 4 * w * h.
Let us consider the following image, a square of 256 pixel side length.
The color of each pixel (x,y) is set as follows:
the Red component increases along the x-axis from 0 to 255, i.e. R(x,y)=x
the Green component increases along the y-axis from 0 to 255, i.e. G(x,y)=y
the Blue component is constant 0 is each pixel, i.e. B(x,y)=0
the Alpha component, the transparency is constant 255, which means that the pixel is not transparent, at all. So A(x,y)=255
For example,
the left bottom corner pixel (0,255), the color is rgba(0,255,0,255), which is a solid green.
The right top corner pixel (255,0) on the other hand has the color rgba(255,0,0,255), which is pure red.
The left top corner pixel (0,0) is (non-transparent) black rgba(0,0,0,255) and
the right bottom corner pixel (255,255) is a full red-green mixture rgba(255,255,0,255), which is (non-transparent) yellow.
The numeric table representation of this image is thus given by the following
x = 0
|
x = 1
|
... |
x = 255
|
|
|---|---|---|---|---|
y = 0
|
rgba(0,0,0,255)
|
rgba(1,0,0,255)
|
... |
rgba(255,0,0,255)
|
y = 1
|
rgba(0,1,0,255)
|
rgba(1,1,0,255)
|
... |
rgba(255,1,0,255)
|
y = 2
|
rgba(0,2,0,255)
|
rgba(1,2,0,255)
|
... |
rgba(255,2,0,255)
|
...
|
... | ... | ... | |
y = 255
|
rgba(0,255,0,255)
|
rgba(1,255,0,255)
|
... |
rgba(255,255,0,255)
|
and this is represented by a ImageData object with the three properties
{
  width : 256,
  height: 256,
  data  : [ 0,0,0,255,   1,0,0,255,   ..., 255,0,0,255,
            0,1,0,255,   1,1,0,255,   ..., 255,1,0,255,
            ...,
            0,255,0,255, 1,255,0,255, ..., 255,255,0,255 ]
}
where the length of the data array is 4*256*256, i.e. it contains 262144 integer components.
(For the actual generation of this ImageData object and the previous canvas picture, see Example 1 below.)
createImageData (sw,sh) and createImageData (imagedata)
CanvasRenderingContext2D.createImageData (sw,sh)returns an
ImageDataobject of the given (source) widthswand heightsh. All4 * sw * shcomponents in thedataarray are set to0, i.e. each pixel is transparent black.
CanvasRenderingContext.2D.createImageData (imagedata)returns an
ImageDataobject with the same dimensions as the given argument (which is itself anImageDataobject). Again, all the pixels in the returned object are transparent black.
The latter of the two calls createImageData(imagedata) is thus just a short version for calling createImageData(imagedata.width, imagedata.height).
Each createImageData() call thus returns a ImageData object, but one in which all array elements of the data array are set to 0. However, once the object is created, all these RGBA color components can be altered by explicit references to data[i].
Below we present a couple of demonstrations for these techniques.
getImageData (sx, sy, sw, sh)
CanvasRenderingContext2D.getImageData(in float sx, in float sy, in float sw, in float sh)returns the
ImageDatathat represents the rectangular section of the givenCanvasRenderingContext2Dthat has its origin in(sx,sy), isswpixels wide andshpixels high.
Below we show how this works in a couple of examples.
putImageData (imagedata, dx, dy) and putImageData (imagedata, dx, dy, sx, sy, sw, sh)
CanvasRenderingContext2D.putImageData (imagedata, dx, dy)takes a given
ImageDataobjectimagedataand inserts it at(dx,dy)into the givenCanvasRenderingContext2D.
CanvasRenderingContext2D.putImageData (imagedata, dx, dy, dx, dy, dw, dh)does the same as the previous function call, but this time, only the part from
imagedataimage is taken, that has its left upper corner at(dx,dy)and isdwpixels wide anddhpixels high.
For code examples and pictures see next.
Consider the previous picture again:
It was generated by this code snippet
<canvas id="ImageDataSample" width=256 height=256> </canvas>
<script>
  var canvas = document.getElementById('ImageDataSample');
  var w = canvas.width;          // w is 256
  var h = canvas.height;         // h is 256
  var context = canvas.getContext('2d');
  context.addGrid(32);
  var imDat = context.createImageData (w,h);
  var i = 0;
  for (var y = 0; y < h; y++) {
    for (var x = 0; x < w; x++) {
      imDat.data[i++] = x;        // the Red component of (x,y), which is set to x
      imDat.data[i++] = y;        // the Green component of (x,y), which is set to y
      imDat.data[i++] = 0;        // the Blue component of (x,y), which is constant 0
      imDat.data[i++] = 255;      // the Alpha/transparency of (x,y), which is constant 255, i.e. fully visible
    };
  };
 context.putImageData (imDat, 0, 0)
</script>
First, we create an ImageData object, calling it imDat, by invoking context.createImageData(w,h) with w and h both set to 256. At this point the imDat.data array is an array of length 4*256*256, each array component being 0. Setting all these components to the required color code is done in the double for loop. When this loop is left again, imDat is as we wanted it. So in the last step, calling context.putImageData(imDat,0,0) inserts this ImageData object with its left upper corner at (0,0) into the canvas.
Let us show how we cut out a rectangular section and copy it into the same picture, again. Consider this canvas
generated by this code snippet
context.fillStyle = 'black';
context.font = '40pt sans-serif';
context.fillText ('Hi there!',30,70);
We now cut out the 260x60 pixel rectangle at (20,20) and place its copy at (320,20). If we indicate this rectange by a red frame, the whole operation is displayed as
The actual copying is done by adding the following two lines to the previous code
var imDat = context.getImageData (20,20,260,60);
context.putImageData (imDat,320,20);
With the first line, we extact an ImageData object, called imDat. With the second line, we insert that object into the picture, again.
The picture generated by the previous code is indeed this
We just made a simple copy of a canvas section in two steps: 1. get an ImageData object, named imDat and 2. put it into the canvas context, again.
We now modify the obtained object before putting it back, performing three steps:
cut out imDat as before with getImageData(),
create a new ImageData object mirImDat with the mirror image of imDat by
initialize mirImDat by means of createImageData() as an ImageData object with the same size as imDat
update all the color components of mirImDat.data (so that each row of imDat is reversed in mirImDat)
put mirImDat back into the picture with putImageData()
The resulting picture is this
and the full source code to generate that canvas is this:
// 0. Generated the text field
context.fillStyle = 'black';
context.font = '40pt sans-serif';
context.fillText ('Hi there!',30,70);

// 1. Cut out the ImageData object named imDat
var w = 260;                                     // explicitly define the width w of the rectangle area
var h = 60;                                      // explicitly define the height h of the rectangle
var imDat = context.getImageData(20,20,w,h);     // cut out the rectangle and save it in an ImageData object named imDat

// 2. Create a new ImageDate object with the mirror image, called mirImDat
var mirImDat = context.createImageData(imDat);   // a. initialze mirImDat; all components of mirImDat.data are 0 here
for (var y = 0; y < h; y++) {                    // b. update the mirImDat.data components
  for (var x = 0; x < w; x++) {
    var d = 4 * (y * w + x);
    var s = 4 * (y * w + (w - (x + 1)));
    mirImDat.data [d + 0] = imDat.data [s + 0];
    mirImDat.data [d + 1] = imDat.data [s + 1];
    mirImDat.data [d + 2] = imDat.data [s + 2];
    mirImDat.data [d + 3] = imDat.data [s + 3];
  };                                              // done updating the mirImDat.data components
};

// 3. Insert the mirImDat into the image again
context.putImageData (mirImDat,320,20);
Note, that in step 2.a, mirImDat is initialized by
var mirImDat = context.createImageData(imDat);As explained, createImageData(imDat) does not fully clone imDat, it only creates an ImageData object with the same dimensions, but with all color values in the data array set to 0. Accordingly, the previous line could be replaced by following line, which does exactly the same:
var mirImDat = context.createImageData(w,y);In the nested loops of step 2.b, the components of mirImDat.data are then updated to the correct values that turn mirImDat into the true mirror image of imDat.
This example of a mirror copy demonstrates, how all the transformation methods of the CanvasRenderingContext2D could be re-implemented by means of these manipulations on the pixel level.
The following is a copy of the interface definitions of the HTMLCanvasElement, the CanvasRenderingContext2D, and a few other related objects, as given by the [W3C.org] standard. The content table of the Reference part of this Canvas Handbook resembles the first two main interfaces.
interface HTMLCanvasElement : HTMLElement {
  attribute unsigned long width;
  attribute unsigned long height;
  DOMString toDataURL(optional in DOMString type, in any... args);
  Object getContext(in DOMString contextId);
};
interface CanvasRenderingContext2D {
// back-reference to the canvas
readonly attribute HTMLCanvasElement canvas;
// state
void save(); // push state on state stack
void restore(); // pop state stack and restore state
// transformations (default transform is the identity matrix)
void scale(in float x, in float y);
void rotate(in float angle);
void translate(in float x, in float y);
void transform(in float m11, in float m12, in float m21, in float m22, in float dx, in float dy);
void setTransform(in float m11, in float m12, in float m21, in float m22, in float dx, in float dy);
// compositing
attribute float globalAlpha; // (default 1.0)
attribute DOMString globalCompositeOperation; // (default source-over)
// colors and styles
attribute any strokeStyle; // (default black)
attribute any fillStyle; // (default black)
CanvasGradient createLinearGradient(in float x0, in float y0, in float x1, in float y1);
CanvasGradient createRadialGradient(in float x0, in float y0, in float r0, in float x1, in float y1, in float r1);
CanvasPattern createPattern(in HTMLImageElement image, in DOMString repetition);
CanvasPattern createPattern(in HTMLCanvasElement image, in DOMString repetition);
CanvasPattern createPattern(in HTMLVideoElement image, in DOMString repetition);
// line caps/joins
attribute float lineWidth; // (default 1)
attribute DOMString lineCap; // "butt", "round", "square" (default "butt")
attribute DOMString lineJoin; // "round", "bevel", "miter" (default "miter")
attribute float miterLimit; // (default 10)
// shadows
attribute float shadowOffsetX; // (default 0)
attribute float shadowOffsetY; // (default 0)
attribute float shadowBlur; // (default 0)
attribute DOMString shadowColor; // (default transparent black)
// rects
void clearRect(in float x, in float y, in float w, in float h);
void fillRect(in float x, in float y, in float w, in float h);
void strokeRect(in float x, in float y, in float w, in float h);
// path API
void beginPath();
void closePath();
void moveTo(in float x, in float y);
void lineTo(in float x, in float y);
void quadraticCurveTo(in float cpx, in float cpy, in float x, in float y);
void bezierCurveTo(in float cp1x, in float cp1y, in float cp2x, in float cp2y, in float x, in float y);
void arcTo(in float x1, in float y1, in float x2, in float y2, in float radius);
void rect(in float x, in float y, in float w, in float h);
void arc(in float x, in float y, in float radius, in float startAngle, in float endAngle, in boolean anticlockwise);
void fill();
void stroke();
void clip();
boolean isPointInPath(in float x, in float y);
// text
attribute DOMString font; // (default 10px sans-serif)
attribute DOMString textAlign; // "start", "end", "left", "right", "center" (default: "start")
attribute DOMString textBaseline; // "top", "hanging", "middle", "alphabetic", "ideographic", "bottom" (default: "alphabetic")
void fillText(in DOMString text, in float x, in float y, optional in float maxWidth);
void strokeText(in DOMString text, in float x, in float y, optional in float maxWidth);
TextMetrics measureText(in DOMString text);
// drawing images
void drawImage(in HTMLImageElement image, in float dx, in float dy, optional in float dw, in float dh);
void drawImage(in HTMLImageElement image, in float sx, in float sy, in float sw, in float sh, in float dx, in float dy, in float dw, in float dh);
void drawImage(in HTMLCanvasElement image, in float dx, in float dy, optional in float dw, in float dh);
void drawImage(in HTMLCanvasElement image, in float sx, in float sy, in float sw, in float sh, in float dx, in float dy, in float dw, in float dh);
void drawImage(in HTMLVideoElement image, in float dx, in float dy, optional in float dw, in float dh);
void drawImage(in HTMLVideoElement image, in float sx, in float sy, in float sw, in float sh, in float dx, in float dy, in float dw, in float dh);
// pixel manipulation
ImageData createImageData(in float sw, in float sh);
ImageData createImageData(in ImageData imagedata);
ImageData getImageData(in float sx, in float sy, in float sw, in float sh);
void putImageData(in ImageData imagedata, in float dx, in float dy, optional in float dirtyX, in float dirtyY, in float dirtyWidth, in float dirtyHeight);
};interface CanvasGradient {
// opaque object
void addColorStop(in float offset, in DOMString color);
};interface CanvasPattern {
// opaque object
};interface TextMetrics {
readonly attribute float width;
};interface ImageData {
readonly attribute unsigned long width;
readonly attribute unsigned long height;
readonly attribute CanvasPixelArray data;
};interface CanvasPixelArray {
readonly attribute unsigned long length;
getter octet (in unsigned long index);
setter void (in unsigned long index, in octet value);
};CSS colors can be specified by the following methods:
hexadecimal colors, specified as
#RRGGBB, whereRRdenotes the red,GGis the green andBBthe blue component of the color and each of these six letters stands for a hexadecimal value, i.e. one of0, ...,9,A, ...,F. For example,
#0000FFhas no (=00) red, no green, and full (=FF) blue components, in other words, this is pure blue.RGB colors work the same way that hexadecimal colors do, but their syntax is different, namely
rgb(R,G,B), whereR,GandBalso values for the red, green and blue components, respectively. But here, the values are either decimal integers between0and255(including), or percentage values between0%and100%. For example,
rgb(0,0,255)is the color with no red, no green and full blue components. So this is pure blue, again.
rgb(0%,0%,100%)is also the pure blue.RGBA colors are specified by the form
rgba(R,G,B,A), where theR,G,Bpart is the same as in RGB colors. The alpha parameterAspecifies the opacity and is a value between0.0(fully transparent) and1.0(fully opaque). For example,
rgba(100%,0%,0%,0.5)is a purely red color, which is half transparent.HSL colors has the form
hsl(H,S,L), specifying the hue, saturation and lightness for a cylindrical-coordinate representation of colors. HueHis a degree on the color wheel, from0to360, where0(or360) is red,120is green, and240is blue. SaturationSis a percentage value from0%to100%, where0%means a shade of gray and100%is the full color. LightnessLis also a percentage,0%is black and100%is white. For example
hsl(120,65%,75%)HSLA colors has the form
hsla(H,S,L,A), whereH,SandLare the same as in HSL colors and the alpha parameterAdefines the opacity, from0.0(for fully transparent) to1.0(fully opaque).Predefined or cross-browser color names are colors in HTML and CSS specified by their name, such as
BlueVioletorDarkBlue. There are
17 standard colors:
aqua,black,blue,fuchsia,gray,green,lime,maroon,navy,olive,orange,purple,red,silver,teal,whiteandyellow.130 more, from
AliceBluetoYellowGreen
Links:
The CSS3 color definition of the W3 and on w3schools.com
An overview of the color names, either sorted alphabetically by their name or by their corresponding HEX value
The w3schools site also has a Color Picker and Color Mixer
For more information, see the standard description on w3.org or the reference on w3schools.com.
| Font properties in CSS | |
|---|---|
| CSS property | possible values |
font-style
|
normal, italic, oblique, inherit Default is normal and inherit means inherited from the parent element.
|
font-variant
|
normal (default), small-caps, inherit (Default is normal and inherit means inherited from the parent element.)
|
font-weight
|
normal, bold, lighter, 100, 200, 300, 400, 500, 600, 700, 800, 900, inherit (Default is normal, which is the same as 400. And bold is the same as 700.)
|
font-size
|
xx-small, x-small, small, medium, large, x-large, xx-large, smaller, larger, inherit or some length specified as nn px, nncm, nn٪,
|
font-family
|
There are two types of font family names:
font-family property can hold several values, separated by commas, as a "fallback" system. If the browser does not support the first font, it tries the next one. For example, font-family="Verdana, cursive" font-family="'Times New Roman', Georgia, Serif, monospace"
|
font
|
This property sets all the font properties in one declaration. The properties that can be set are (in this order) font-style font-variant font-weight font-size font-family For example, "italic small-caps bold 12px arial, sans-serif",
|
Note, that there are some new rules for the change from HTML4 to HTML5:
The doctype declaration has been simplified again. The long and hard-to-remember declarations are now a thing of the past: Just
<!DOCTYPE html>suffices.
The different versions for the type of <script> tags have been gone. It is no longer necessary to add the type="text/javascript" attribute, this is the assumed default now. Just
<script>
  // ... JavaScript code ...
</script>
is sufficient for script tags.
Below, we list and discuss some templates for HTML5 files that contain canvas elements. All these examples will produce the same browser view, namely this:
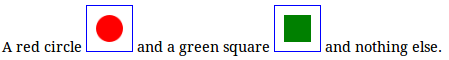
The difference lies underneath in the organization of the HTML and JavaScript code.
The text with a circle and square is generated by the following HTML file, say example.html
<!DOCTYPE html>
<html>
  <head>
    <title> First Example </title>
    <meta http-equiv="Content-Type" content="text/html; charset=utf-8" />
    <style type="text/css">
      canvas { border: solid 1pt blue; }      /* draws a blue frame around each <canvas>...</canvas> tag */
    </style>
  </head>
  <body>
    A red circle
    <canvas id="CanvasNo1" width=50 height=50> </canvas>
    <script>
      var canvas1 = document.getElementById('CanvasNo1');
      var context1 = canvas1.getContext('2d');
      context1.fillStyle = 'red';
      context1.beginPath();
      context1.arc (25,25,15,0,2*Math.PI);
      context1.fill();
    </script>
    and a green square
    <canvas id="CanvasNo2" width=50 height=50> </canvas>
    <script>
      var canvas2 = document.getElementById('CanvasNo2');
      var context2 = canvas2.getContext('2d');
      context2.fillStyle='green';
      context2.fillRect (10,10,30,30);
    </script>
    and nothing else.
  </body>
</html>
In this file we used the method from the introduction (see A first example and Basic setup): For each canvas, we place a <canvas>...</canvas> tag with a separate id attribute, followed by a <script>...</script>, in which the canvas is further developed.
This method suffices for simple pictures and small files. But when the pictures become more complex and external image or media files are involved, this will not work anymore and empty canvas pictures will appear instead. So in general, it is not a good advice to organize your files that way.
By the way, recall, there are different kind of syntax rules for comments, depending on the kind of code:
in HTML, a comment
...is placed inside a<!-- ... -->in CSS, a comment
...is placed inside a/* ... */in JavaScript, a comment is everything after a
//on the given line.
Alternatively, there is also the block comment/* ... */, as in CSS.
When we deal with non-trivial projects, it is a good custom to distinguish style from content and place the different codes into separate files. In our case, these are three:
a HTML5 file called example.html, made of this
<!DOCTYPE html>
<html>
  <head>
    <title> Second Example </title>
    <meta http-equiv="Content-Type" content="text/html; charset=utf-8" />
    <link rel="stylesheet" type="text/css" href="example.css" />
    <script src="example.js"> </script>
  </head>
  <body>
    A red circle
    <canvas id="CanvasNo1" width=50 height=50> </canvas>
    and a green square
    <canvas id="CanvasNo2" width=50 height=50> </canvas>
    and nothing else.
  </body>
</html>
a CSS file called example.css, containing
canvas {
  border: solid 1pt blue;   /* draws a blue frame around each <canvas>...</canvas> tag */
}
a JavaScript file called example.js, containing
// First canvas with the red circle
var canvas1 = document.getElementById('CanvasNo1');
var context1 = canvas1.getContext('2d');
context1.fillStyle = 'red';
context1.beginPath();
context1.arc (25,25,15,0,2*Math.PI);
context1.fill();

// Second canvas with the green square
var canvas2 = document.getElementById('CanvasNo2');
var context2 = canvas2.getContext('2d');
context2.fillStyle='green';
context2.fillRect (10,10,30,30);
The main HTML file holds the content and defines the organization of the whole page. The CSS file sets the non-default style features and is integrated via
<link rel="stylesheet" type="text/css" href="example.css" />instruction. The JavaScript finally contains the drawings for the two canvas elements and it is integrated via
<script src="example.js"> </script>This separation of components is usually considered a better design.
However, is this fashion, it does not work! Instead of the previous picture with the circle and square, we see this
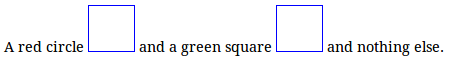
in the browser. Only the CSS border of the canvas elements appears, without the JavaScript generated picture elements.
When the browser starts to read the HTML file, it loads the CSS and JavaScript file, as demanded in the <head>...</head> section, and then continues to generate the <body>...</body> section with the two canvas elements. In this order of execution, the JavaScript code is executed before the canvas elements are present, and that fails. The canvas pictures remain empty.
There are several strategies to overcome this problem:
js files in defer mode
In the previous HTML file example.html, we can replace the line
<script src="example.js"> </script>by
<script src="example.js" defer> </script>i.e. we add the defer attribute to the <script> tag. That way, the execution of the JavaScript file example.js is delayed until the whole HTML file is loaded, first. With this modification we obtain the intended browser picture
again.
onload to the <body> tag
The order in which different code types are executed can also be influenced by JavaScript itself. All canvas drawings in JavaScript are now enclosed in a function named draw(). And an event listener is added to the body that ensures that draw() is executed only onload, i.e. when the HTML code in the body is fully loaded, first. The three files are now given by
example.html is
<!DOCTYPE html>
<html>
  <head>
    <title> Another Example </title>
    <meta http-equiv="Content-Type" content="text/html; charset=utf-8" />
    <link rel="stylesheet" type="text/css" href="example.css" />
    <script src="example.js"> </script>
  </head>
  <body onload=draw()>
    A red circle
    <canvas id="CanvasNo1" width=50 height=50> </canvas>
    and a green square
    <canvas id="CanvasNo2" width=50 height=50> </canvas>
    and nothing else.
  </body>
</html>
Note the new onload attribute in the <body> tag.
example.css is unchanged and still contains
canvas {
  border: solid 1pt blue;   /* draws a blue frame around each <canvas>...</canvas> tag */
}
example.js has now wrapped all the previous content in a function declaration:
function draw() {
  // First canvas with the red circle
  var canvas1 = document.getElementById('CanvasNo1');
  var context1 = canvas1.getContext('2d');
  context1.fillStyle = 'red';
  context1.beginPath();
  context1.arc (25,25,15,0,2*Math.PI);
  context1.fill();
  // Second canvas with the green square
  var canvas2 = document.getElementById('CanvasNo2');
  var context2 = canvas2.getContext('2d');
  context2.fillStyle='green';
  context2.fillRect (10,10,30,30);
};window.onload
As a last variation to the previous template, we can also remove all JavaScript from the html file again and add the event listener in the js file. The underlying mechanism is still the same, but the encoding is different. This involves the following modifications of the previous file listings:
example.html now has the onload attribute removed from the <body> tag, again.
example.js has one additional line, namely
window.onload = draw;It doesn't matter where we put that line in the file, either before or after the draw() function declaration.
The last templates very much represent the commonly recommended methods on how canvas elements ought to be integrated in web pages. Each of these methods can still be refined by increasing the detection of errors. Both browsers and JavaScript are originally designed to "degrate gracefully" in the sense that they try to avoid the collapse of things, but rather tend to process as much as possible. The browser that doesn't understand <canvas> tags displays the fallback (the text ... inside the <canvas>...</canvas>) instead of printing a big error message all over the screen. And when a variable in JavaScript is undefined, the script doesn't protest in the browser window, but tries to continue with an undefined value for the variable.
The price for this forgiving design is the difficulty to locate the origin of problems, once they occurred. And the more professional the programming, the more strict and less forgiving the program flows and more and more error detections are built in.
For the HTML part this means that one usually does provide a fallback text such as
<canvas> HERE SHOULD BE THE CANVAS PICTURE, BUT YOUR BROWSER IS UNABLE TO RENDER IT! <canvas>For the JavaScript part this involves the modularization of code into separate parts and thorough verification on the correctness of variables and objects.
For example, we can split the draw() function into drawCanvas1() and drawCanvas2(), for each occurring canvas element. And instead of writing say
function drawCanvas2() {
  var canvas = document.getElementById('CanvasNo2');
  var context = canvas.getContext('2d');
  context.fillStyle='green';
  context.fillRect (10,10,30,30);
};
we can built in verifications like so
function drawCanvas2() {
  var canvas = document.getElementById('CanvasNo2');
  if (canvas) {
    var context = canvas.getContext('2d');
    if (context) {
      context.fillStyle='green';
      context.fillRect (10,10,30,30);
    } else {
      throw Error ("The 2D context is undefined.");
    }
  } else {
    throw Error ("There is no HTML element with the id='CanvasNo2'.");
  };
};
Instead of pretty silent error messages we can also cause popup windows to alarm: just replace each
throw Error ("...");by
alert ("...");strokeCircle() and fillCircle()In JavaScript it is quite easy to extend the toolset for the canvas and 2d context any way you like by writing functions. Suppose we want to write functions that create circles very similar to the way fillRect() and strokeRect() works for creating rectangles.
These functions should have two number arguments x and y for the location of the circles center point, and r for the radius.
The first version of our implementation is this
function fillCircle (contextObj,x,y,r) {
  contextObj.beginPath();
  contextObj.arc (x,y,r,0,2*Math.PI);
  contextObj.fill();
};
which means that the syntax of a function call is
`fillCircle (contextObj, x, y, r)`where contextObj is a CanvasRenderingContext2D object. So in order to generate a picture with a green bullet like this
you would have to to write some code like this
<canvas id="FillCircleTest1" width=60 height=60> </canvas>
<script>
  var context = document.getElementById('FillCircleTest1').getContext('2d');
  context.fillStyle = 'green';
  fillCircle(context,30,30,20);
</script>Alternative, we could change the function syntax to
`fillCircle (canvasId, x, y, r)`where canvasId is the value of the id attribute in the according <canvas> tag. This is implemented by
function fillCircle (canvasId,x,y,r) {
  var context = document.getElementById (canvasId).getContext('2d');
  context.beginPath();
  context.arc (x,y,r,0,2*Math.PI);
  context.fill();
};
That way, we could simply write
<canvas id="FillCircleTest2" width=60 height=60> </canvas>
<script>
  fillCircle('FillCircleTest2',30,30,20);
</script>
to generate this image
But as this version excludes the context, and the context is the object you need when you want to modify say the color.
If we want to built our functions according to the object-oriented design of the context, we would prefer to have the context not as a function argument (like in the first version), but fillCircle() should be a method on the 2d context, so that we can call it like this
context.fillCircle (x, y, r)For that, we would have to extend the method repertoire of the CanvasRenderingContext2D object. And in fact, that is possible in JavaScript by making use of its prototype design. The implementation would thus be like this
CanvasRenderingContext2D.prototype.fillCircle = function (x,y,r) {
  this.beginPath();
  this.arc (x,y,r,0,2*Math.PI);
  this.fill();
}
So now we create this canvas picture
by writing this code
<canvas id="FillCircleTest3" width=60 height=60> </canvas>
<script>
  var context = document.getElementById('FillCircleTest3').getContext('2d');
  context.fillStyle = 'purple';
  context.fillCircle (30,30,20);
</script>
The strokeCircle() implementation in this manner is then obviously
CanvasRenderingContext2D.prototype.strokeCircle = function (x,y,r) {
  this.beginPath();
  this.arc (x,y,r,0,2*Math.PI);
  this.stroke();
}
This third, prototype-based implementation is probably closest to the original style. 30
addGrid(delta,color,font)
CanvasRenderingContext2D.addGrid (delta, color, font)draws a coordinate grid on the given canvas. It has three parameters:
deltais the distance of the lines in the grid, given as the number of pixels, with a default value of25.coloris a CSS color string that sets the color of the grid and number coordinates. The default color is'blue'.fontis a CSS font string to determine the font of the number coordinates. The default font value is'8px sans-serif'.Each of the parameters is optional, you can call
addGrid(),addGrid(delta),addGrid(delta,color)oraddGrid(delta,color,font).
For example, on a default (300x150) size canvas,
addGrid() uses the default settings and produces
addGrid(50,'red') is
addGrid(20,'black','5px sans-serif') is this
addGrid()
If you want to use the addGrid() method in your own scripts, copy the following implementation of the function into your own file.
CanvasRenderingContext2D.prototype.addGrid = function (delta, color, fontParams) {
  // define the default values for the optional arguments
  if (! arguments[0]) { delta = 25; }
  if (! arguments[1]) { color = 'blue'; }
  if (! arguments[2]) { fontParams = '8px sans-serif'; }
  // extend the canvas width and height by delta
  var oldWidth = this.canvas.width;
  var oldHeight = this.canvas.height;
  this.canvas.width = oldWidth + delta;
  this.canvas.height = oldHeight + delta;
  // draw the vertical and horizontal lines
  this.lineWidth = 0.1;
  this.strokeStyle = color;
  this.font = fontParams;
  this.beginPath();
  for (var i = 0; i * delta < oldWidth; i ++) {
    this.moveTo (i * delta, 0);
    this.lineTo (i * delta, oldHeight);
  }
  for (var j = 0; j * delta < oldHeight; j ++) {
    this.moveTo (0, j * delta);
    this.lineTo (oldWidth, j * delta);
  }
  this.closePath();
  this.stroke();
  // draw a thicker line, which is the border of the original canvas
  this.lineWidth = 0.5;
  this.beginPath();
  this.moveTo(0,0);
  this.lineTo(oldWidth,0);
  this.lineTo(oldWidth,oldHeight);
  this.lineTo(0,oldHeight);
  this.lineTo(0,0);
  this.closePath();
  this.stroke();
  // set the text parameters and write the number values to the vertical and horizontal lines
  this.font = fontParams
  this.lineWidth = 0.3;
  // 1. writing the numbers to the x axis
  var textY = oldHeight + Math.floor(delta/2); // y-coordinate for the number strings
  for (var i = 0; i * delta <= oldWidth; i ++) {
    this.strokeText (i * delta, i * delta, textY);
  }
  // 2. writing the numbers to the y axis
  var textX = oldWidth + 5; // x-coordinate for the number strings
  for (var j = 0; j * delta <= oldHeight; j ++) {
    this.strokeText (j * delta, textX, j * delta);
  }
};
[HOME] http://bucephalus.org/text/CanvasHandbook/CanvasHandbook.html↩
[FORUM] http://www-bucephalus-org.blogspot.nl/2013/09/the-html5-canvas-handbook.html↩
This final HTML file CanvasHandbook.html is generated from the following source files:
CanvasHandbook.markdown containing the source text for the HTML document. The conversion into HTML is done with Pandoc.
CanvasHandbook.js containing the tool functions (such as addGrid()) and the scripts for the canvas elements. This code is integrated into the main document according to the method described in the appendix.
I also used the CodeDown document generator to convert the js file into a more readable document file CanvasHandbook.js.html, which was itself generated from an intermediate Markdown file CanvasHandbook.js.markdown.
Two CSS files: the standard CodeDown.css stylesheet and CodeDownPrint.css for printing the file with a smaller font.
Image files: horse.jpg, grayhorse.jpg, baselines.png, TemplateCircleAndSquare.png and TemplateCircleAndSquare2.png. All other pictures in the browser are generated by <canvas> tags and JavaScript.
[W3C] http://www.w3.org/TR/2009/WD-html5-20090825/the-canvas-element.html↩
[WHATWG] http://www.whatwg.org/specs/web-apps/current-work/multipage/the-canvas-element.html#the-canvas-element↩
If you do not see the "Hello" message or if you read "GO AND UPDATE YOUR BROWSER BEFORE YOU READ ON!" instead, you should really follow that advise. Otherwise, none of the pictures in this handbook will be displayed properly and the whole text does not make sense.↩
What you see inside the <script>...</script> tag is not HTML, but JavaScript code, and that has a different syntax. One important feature is the comment, a piece of information inserted into programming code, which is only meant as an aid to understand and maintain the code. A comment only serves the human reader of the code and is ignored by the computer program, in this case the JavaScript engine of the browser.
All text on a line after a double slash "//" is a comment in JavaScript. In the given example, "// identify the canvas element" is a comment and explains what the code left of the "//" is doing. We will make heavy use of comments in all our JavaScript code examples.↩
You probably know about the DOM (Document Object Model). Each web document is first of all given as a HTML file. When this HTML code is loaded, the browser translates the document into a hierarchical JavaScript tree object. Each element of the HTML code is represented as a node object in this tree. The root to that tree is accessed by the predefined document keyword. Any element node in this tree that corresponds to a tag with an id is then accessed by a call of document.getElementById('...'). Alternatively we could also get the array of all HTMLCanvasElement objects in one document by calling document.getElementsByTagName('canvas'). But we will not use this in our text here. ↩
In JavaScript, a string is enclosed in either single quotes '...' or double quotes "...". For example, 'Hello world!' and "Hello world!" both denote the same string. There are subtle differences between these two versions, but for now we can neglects these details. So document.getElementById('Example1') and document.getElementById("Example1") have the same effect and you may freely choose between these two versions.↩
Note, that the direction of the y-axis is really opposite the standard direction in cartesian coordinate systems!↩
Actually, the drawn red dot is not just 1 pixel big, but has a radius of 4 pixel. Otherwise it might be too difficult to see.↩
It is however possible, to shift the whole coordinate system on the canvas, so that e.g. the origin (0,0) no longer is the left upper corner, but moves to the center, and so that points like (-60,50) now do become part of the picture. This can be done with transformations such as translate(x,y).↩
The six lines that draw the three colored rectangles are wrapped in this code, according to our previous template:
<canvas id="GermanFlag" width=200 height=120> </canvas>
<script>
  // get the canvas object and its context
  var canvas = document.getElementById('GermanFlag');
  var context = canvas.getContext('2d');
  // add the grid with 40 pixels for each step to the next line (see the appendix on this addGrid() method
  context.addGrid(40);            // THIS IS NOT A STANDARD METHOD!!!
  // now draw the colored rectangles
  // now draw the colored rectangles
  context.fillStyle = '#000000';
  context.fillRect(0, 0,200,40);
  context.fillStyle = '#FF0000';
  context.fillRect(0,40,200,40);
  context.fillStyle = '#FFCC00';
  context.fillRect(0,80,200,40);
</script>This idea of the clickable canvas was suggested in html5doctor.com.↩
The transform() method however is not able to perform any (topological) transformation in the general geometrical sense, but only what is called an affine transformation. For example, it cannot produce a fisheye perspective, because during affine transformations, straight and parallel lines must remain straight and parallel, respectively. It is possible however, to implement topological transformations by making use of the pixel manipulations, but that is a different approach.↩
With the method described in the appendix, we can add shear() as a new method to the CanvasRenderingContext2D object like so:
CanvasRenderingContext2D.prototype.shear = function (x,y) {
  this.transform (1, y, x, 1, 0, 0);
};
I took the idea and definition of the shear() method from David Flanagan, Canvas Pocket Reference.↩
(a,b,c,d,e,f). It might be given as an array [a,b,c,d,e,f]. In [WHATWG] this was stored as a SVGMatrix object. For the computation of transformation compositions, it is convenient to store it as a 3x2 matrix of the form
a
|
c
|
e
|
b
|
d
|
f
|
0
|
0
|
1
|
because the composition is then nothing but a matrix multiplication.↩
⊗ is as follows:(a1,b1,c1,d1,e1,f1) and (a2,b2,c2,d2,e2,f2) thenwhere(a1,b1,c1,d1,e1,f1)⊗(a2,b2,c2,d2,e2,f2)=(a3,b3,c3,d3,e3,f3)
When the parameters are stored as 3x3 matrices, then composition is nothing but a matrix multiplication, namelya3 = (a2 * a1) + (c2 * b1)
b3 = (b2 * a1) + (d2 * b1)
c3 = (a2 * c1) + (c2 * d1)
d3 = (b2 * c1) + (d2 * d1)
e3 = (a2 * e1) + (c2 * f1) + e2
b3 = (b2 * e1) + (d2 * f1) + f2
a2c2e2b2d2f2001⊗
a1c1e1b1d1f1001=
a3c3e3b3d3f3001
Note, that τ1⊗τ2 meant that first τ1 and then τ2 is performed. In matrix multiplication, this order is reversed: the matrix of τ2 is multiplied with the matrix of τ1, not the other way round. (Composition and matrix multiplication is not commutative. It is associative however, i.e. (τ1⊗τ2)⊗τ3 = τ1⊗(τ2⊗τ3).)
We can also implement this as a JavaScript function: given two arrays arr1=[a1,b1,c1,d1,e1,f1] and arr2=[a2,b2,c2,d2,e2,f2], then composeTransform(arr1,arr2) returns their composition [a3,b3,c3,d3,e3,f3].
function composeTransform (arr1, arr2) {
  if (Array.isArray (arr1) && Array.isArray (arr2)) {
    if (arr1.length === 6 && arr2.length === 6) {
      // components of arr1
      var a1 = arr1[0]; var b1 = arr1[1]; var c1 = arr1[2]; var d1 = arr1[3]; var e1 = arr1[4]; var f1 = arr1[5];
      // components of arr2
      var a2 = arr2[0]; var b2 = arr2[1]; var c2 = arr2[2]; var d2 = arr2[3]; var e2 = arr2[4]; var f2 = arr2[5];
      // components of the resulting array
      var a3 = (a2 * a1) + (c2 * b1);
      var b3 = (b2 * a1) + (d2 * b1);
      var c3 = (a2 * c1) + (c2 * d1);
      var d3 = (b2 * c1) + (d2 * d1);
      var e3 = (a2 * e1) + (c2 * f1) + e2;
      var f3 = (b2 * e1) + (d2 * f1) + f2;
      return [a3, b3, c3, d3, e3, f3];
    } else {
      throw Error ("The two array arguments of composeTransform(arr1,arr2) must both have six components each.");
    }
  } else {
    throw Error ("The two arguments of composeTransform(arr1,arr2) must both be arrays.");
  }
};
In case the arguments arr1 and arr2 are not both arrays of length 6, an error message is thrown.↩
As mentioned before, in this standard, the parameters (a,b,c,d,e,f) of the currentTransform was an SVGMatrix object.↩
⊗ is as follows:(a1,b1,c1,d1,e1,f1) and (a2,b2,c2,d2,e2,f2) thenwhere(a1,b1,c1,d1,e1,f1)⊗(a2,b2,c2,d2,e2,f2)=(a3,b3,c3,d3,e3,f3)
When the parameters are stored as 3x3 matrices, then composition is nothing but a matrix multiplication, namelya3 = (a2 * a1) + (c2 * b1)
b3 = (b2 * a1) + (d2 * b1)
c3 = (a2 * c1) + (c2 * d1)
d3 = (b2 * c1) + (d2 * d1)
e3 = (a2 * e1) + (c2 * f1) + e2
b3 = (b2 * e1) + (d2 * f1) + f2
a2c2e2b2d2f2001⊗
a1c1e1b1d1f1001=
a3c3e3b3d3f3001
Note, that τ1⊗τ2 meant that first τ1 and then τ2 is performed. In matrix multiplication, this order is reversed: the matrix of τ2 is multiplied with the matrix of τ1, not the other way round. (Composition and matrix multiplication is not commutative. It is associative however, i.e. (τ1⊗τ2)⊗τ3 = τ1⊗(τ2⊗τ3).)
We can also implement this as a JavaScript function: given two arrays arr1=[a1,b1,c1,d1,e1,f1] and arr2=[a2,b2,c2,d2,e2,f2], then composeTransform(arr1,arr2) returns their composition [a3,b3,c3,d3,e3,f3].
function composeTransform (arr1, arr2) {
  if (Array.isArray (arr1) && Array.isArray (arr2)) {
    if (arr1.length === 6 && arr2.length === 6) {
      // components of arr1
      var a1 = arr1[0]; var b1 = arr1[1]; var c1 = arr1[2]; var d1 = arr1[3]; var e1 = arr1[4]; var f1 = arr1[5];
      // components of arr2
      var a2 = arr2[0]; var b2 = arr2[1]; var c2 = arr2[2]; var d2 = arr2[3]; var e2 = arr2[4]; var f2 = arr2[5];
      // components of the resulting array
      var a3 = (a2 * a1) + (c2 * b1);
      var b3 = (b2 * a1) + (d2 * b1);
      var c3 = (a2 * c1) + (c2 * d1);
      var d3 = (b2 * c1) + (d2 * d1);
      var e3 = (a2 * e1) + (c2 * f1) + e2;
      var f3 = (b2 * e1) + (d2 * f1) + f2;
      return [a3, b3, c3, d3, e3, f3];
    } else {
      throw Error ("The two array arguments of composeTransform(arr1,arr2) must both have six components each.");
    }
  } else {
    throw Error ("The two arguments of composeTransform(arr1,arr2) must both be arrays.");
  }
};
In case the arguments arr1 and arr2 are not both arrays of length 6, an error message is thrown.↩
Again, we can combine the two transformations and code lines
context.scale(-1,1);          // same as context.transform(-1,0,0,1,0,0);
context.translate(-300,0); // same as context.transform(1,0,0,1,-300,0);↩(-1,0,0,1,0,0) ⊗ (1,0,0,1,-300,0)=(-1,0,0,1,-300,0)
Of course, we also could have closed the path ourselves, namely by replacing the closePath() line in the code by the alternative line
context.lineTo(150,25); // line from left bottom back to the initial top pointBut the resulting picture is not always exactly the same, because the start and end of the line might not be merged together propertly.↩
Before we added the stroke() call, we set lineWidth to 2.0 and strokeStyle to 'red'.↩
Actually, the result is not exactly the same for closePath() and a lineTo(x0,y0) (with (x0,y0) being the initial point of the path). In the latter method two line endings meet, and their endings are rendered as defined by lineCap. A proper closePath() call on the other hand joins the two endings as defined by the lineJoin property.↩
The [WHATWG] specification had a separate ellipse() method, but that has vanished in the [W3C] standard. The shape we develop here with four quadraticCurveTo() calls is not an ellipse in the strict mathematical sense. But in many practical situations, this will probably do.↩
This example was inspired by the example in the canvas tutorial from the Mozilla Development Network.↩
The insertion of images with drawImage() is explained in Drawing images↩
The standard literature uses the variables dx, dy, dw, dh, sx, sy, sw, sh. It might help if you read the "d" as destination, the "s" as source, and "x", "y", "w" and "h" as point coordinates, width and height, as usual.↩
Suppose, you do not like the object-oriented, prototype-based or procedural programming and you prefer a purely functional style instead. In that case, we would think of a function fillCircle() that returns a circle object when it is called. The [WHATWG] had a Path object that covered shapes in general, so fillCircle() could return a Path object. But in the "evolution" to the [W3] standard, a couple of concepts, including Path, were cut away, and the browsers I tested hide access to all this.↩